The first thing 5.0 broke for me was not a feature. It was a habit.
When something looks stuck on a Wazuh 4.x server, you restart the manager. It is the cheapest diagnostic move there is, and on the 4.x installations I have run it has been safe, because by the time the manager restarts the alert is already written to disk. So I did the same thing on a 5.0.0 Beta 5 stand while its indexer happened to be down. Of the hundred events whose presence in the agent file was confirmed before that restart, none reached the indexer afterwards. How many the manager had already accepted I cannot say: 5.0 exposes no point between acceptance and indexing, which is part of what this comparison is about.
Here is the measurement behind that sentence. Events reach both stands the same way, through their own agent rather than being written into the manager’s own file, and each carries a unique identifier. The number written is confirmed by re-reading the agent’s file rather than taken from the loop counter, and the distinct-event count is exact rather than an estimate. Across all twelve phases the confirmed writes were 100 and no phase produced a duplicate.
| Scenario | Version | Confirmed agent write | Indexed |
|---|---|---|---|
| Indexer down, at least 60 s after the writes, manager left alone | 5.0 Beta 5 | 100 | 100 |
| Indexer down, manager restarted before it returned | 5.0 Beta 5 | 100 | 0 |
| Indexer down, at least 60 s after the writes, manager left alone | 4.14.7 | 100 | 100 |
| Indexer down, manager restarted before it returned | 4.14.7 | 100 | 100 |
Every row is three repetitions, all three agreeing, with no duplicates in any run.
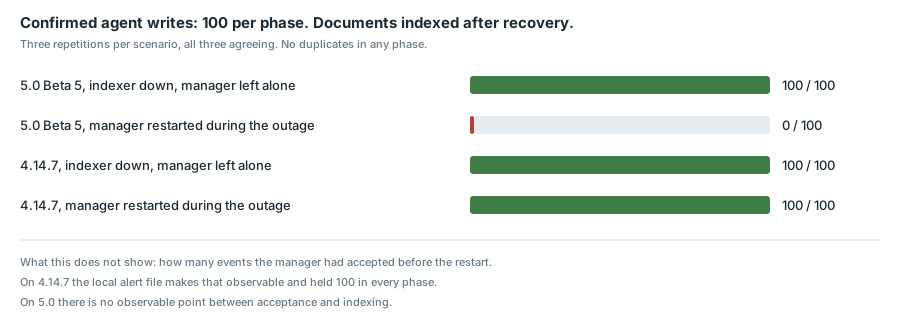
The four scenarios. Confirmed agent writes were 100 everywhere; what differs is how many documents reached the indexer after recovery
The second row is the one that changes a runbook. The first row keeps it honest: on this topology an indexer outage by itself cost nothing. Losing everything required the operator to help. One measurement this design cannot give is how many of those events the manager had already accepted before the restart - on 4.14.7 the local alert file makes that visible, and on 5.0 nothing exposes it, which is itself part of the difference.
What follows is what else an operator has to relearn, grouped by the thing they own rather than by the order data flows. Every number I measured comes from two single-node stands built on 6 and 7 September 2026 from the official images, 4.14.7 and 5.0.0 Beta 5, both native arm64, both under light load. Numbers taken from documentation, public defect reports and the project’s test tracker are marked as such where they appear. The outage scenario was run three times on each version; every other observation here - the paired event, the inventories, the transport, the stream list - is a single run. These are lab observations, not a benchmark, and nothing here transfers to a multi-node deployment carrying production traffic.
The runbook you already have
The mechanism behind those four rows is a change of where an event rests.
In 4.14.7 the manager decodes an event, matches it, generates the alert, and writes it into /var/ossec/logs/alerts/alerts.json. Filebeat ships it from there. During my run the file collected all one hundred alerts while the indexer was unreachable, and they survived the manager restart because they were on disk before the restart began.
In 5.0 Filebeat is gone. The indexer connector took its place, and it is not a replacement daemon at all - it is a shared library linked into the normalization engine, the vulnerability detection service, and the inventory synchronization service. The documentation states its buffering behaviour plainly: the connector buffers in memory and discards buffered documents when the manager stops or restarts, and you should size the indexer for the load rather than treat the manager as a place to absorb indexing delays (indexer connector).
The manager is not silent about the outage itself. It reports both directions:
monitoring: INFO: Indexer node 'https://wazuh.indexer:9200' is no longer available. Reason: Could not resolve hostname
wazuh-manager-modulesd:inventory-sync-server: WARNING: No configured indexer host is currently reachable. Documents will queue or be retried until one comes back; checking again every 60 s.
monitoring: INFO: Indexer node 'https://wazuh.indexer:9200' is available again.
Read that warning carefully, because it is narrower than it looks. The promise to queue and retry belongs to the inventory synchronization service. It is not a promise that anything survives a manager restart, and my run shows that it does not.
So the new rule is specific: while the indexer is unavailable, do not restart a 5.0 manager. Bring the indexer back first, let the backlog drain, then service the manager. On 4.x that ordering did not change the outcome of the run above, which is exactly why it will not be in the runbook you inherited.
One smaller item belongs in the same class. The manager log is now wazuh-manager.log; there is no ossec.log in the installation. A check of mine was still grepping the old path, found nothing, and cheerfully reported that there were no errors in the log. Anything you have that parses manager logs by path will fail the same way, and just as quietly.
Both paths side by side, because the difference is one box:
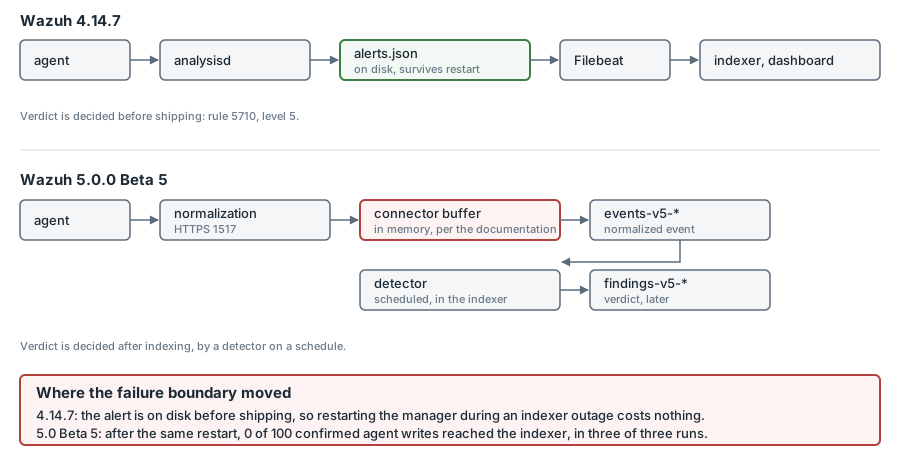
The event path in both versions. Red marks where the document sits when the manager restarts: a file on disk in 4.14.7 and, per the documentation, a buffer in memory in 5.0. What was measured is different: after the restart the events never reached the indexer
The storage contract
If you have automated anything against wazuh-alerts-*, this section is the one that costs you time.
That single pattern is gone. In its place the stand created data streams split two ways. Events and findings are separate populations, and each is split across seven integration categories - access-management, applications, cloud-services, network-activity, other, security, system-activity - plus an unclassified stream for what does not sort into a category, and a separate raw event stream. Alongside them sit state indices for file integrity, packages, users, groups, interfaces, ports and hardware, and service streams for metrics.
Events and findings being separate is not a rename. A normalized event is what the manager produces from a log line; a finding is what a detector produces when a rule matches an event that is already indexed. They have different volumes, different retention needs and different access requirements, and after migration you budget for them separately rather than for one alert index.
Underneath, the indexer moved a major version, and the obvious way to check that gives the wrong answer. Query the root endpoint of a 4.14.7 indexer and it reports 7.10.2. That number is a disguise: opensearch.yml sets compatibility.override_main_response_version, which rewrites the version in the root response for the benefit of old clients (on the compatibility mode). Ask _nodes instead and the answer is 2.19.5, which the opensearch-2.19.5.jar shipped in the installation confirms. Beta 5 sets no such override and both checks agree on 3.6.0. So the move is OpenSearch 2.19.5 on Lucene 9.12.3 to 3.6.0 on Lucene 10.4.0, a major version with the plugin compatibility and query syntax work that implies - and if you audit versions from the root endpoint, you will misread both sides of it.
The detection contract
I pushed one SSH authentication failure through both pipelines to see what a single line becomes.
On 4.14.7, wazuh-logtest walks three phases. Pre-decoding lifts the timestamp, hostname and program_name. Decoding produces the sshd decoder with srcip and srcuser. Matching produces rule 5710 at level 5 (the 0 to 16 scale, pinned at tag v4.14.7), described as sshd: Attempt to login using a non-existent user, in the authentication_failed and invalid_login groups, carrying MITRE T1110.001 and T1021.004 along with GDPR, GPG13, HIPAA, NIST 800-53, PCI DSS and TSC mappings. The tool ends with a line saying an alert will be generated.
On 5.0 the same line becomes a document of 39 fields:
{
  "event.action": "authentication-failure",
  "event.category": ["authentication"],
  "event.outcome": "failure",
  "event.kind": "event",
  "source.ip": "203.0.113.77",
  "source.port": 52814,
  "user.name": "...",
  "process.name": "sshd",
  "process.pid": 4321,
  "wazuh.integration.name": "linux",
  "wazuh.integration.category": "system-activity",
  "wazuh.integration.decoders": ["decoder/core-wazuh-message/0", "decoder/syslog/0", "decoder/system-auth/0"],
  "wazuh.space.name": "standard"
}
The renames are visible on this one example: srcip becomes source.ip, srcuser becomes user.name, and the process name and pid get fields of their own. The decoder is no longer one name but a chain of three versioned assets. Routing is decided by integration category, so this line landed in system-activity rather than in anything named after the rule that would have matched it.
The document itself carries no rule id, no level, no MITRE technique and no compliance mapping. I checked the findings streams seconds after sending the line, saw zero, and nearly wrote that 5.0 produced no verdict at all. That would have been wrong, and the trap is worth naming: in 4.x the verdict is reached during parsing, so checking a second later is reasonable, while in 5.0 detection runs on a schedule and a second later is honestly empty.
The verdict did arrive. The same SSH line produced a finding in wazuh-findings-v5-system-activity, and it differs from the 4.14.7 alert in ways that matter:
| 4.14.7 | 5.0.0 Beta 5 | |
|---|---|---|
| rule identifier | 5710 | 42532ad3-3951-57ee-a3a3-bc6a1b9e6e72 |
| title | sshd: Attempt to login using a non-existent user | Failed authentication attempt - ... from 203.0.113.77 |
| severity | 5 on a 0 to 16 scale | low, one of five categories |
| MITRE | T1110.001, T1021.004 | T1110, T1078 |
| compliance sets | 6 | 10 |
| record model | one alert document | a separate finding document referencing the event |
| link to the source event | the alert is the event | event.doc_id and event.index point at the event document |
So the change is not that 5.0 withholds a verdict. The verdict arrives later, as a separate document, with a UUID instead of a number, a category instead of an integer, and a wider compliance mapping - ten frameworks against six, including CMMC, FedRAMP, ISO 27001 and NIS2, none of which the 4.x alert carried.
The shape of that path is documented in the detection workflow (pinned at the tag, live page). Who produced the verdict is worth a paragraph, because my first guess was wrong. No detector had to be configured: the platform ships 22 of them and 15 are enabled. My event was caught not by a specialist but by wazuh-generic-1, which watches all seven category streams at once. A linux detector also runs, bound to wazuh-events-v5-system-activity on a two-minute interval, but it carries six pre-packaged rules and a failed SSH authentication is not among them. Two of the six rules cover kernel-module loading: one sees insmod, modprobe or kmod through Sysmon for Linux, while the other catches module-signature verification failures in syslog. The remaining four cover reverse shells, writes to authorized_keys, cron/at persistence, and a successful root login by password.
That is the planning-relevant finding. Default coverage is distributed differently in 5.0. What 4.14.7 catches with a named rule at level 5, 5.0 catches with a generic detector at level low. Before assuming parity after migration, run your own corpus through and see which events receive a verdict and at what severity, rather than comparing rule inventories.
Two consequences still hold. Events and findings are separate objects with separate volumes, retention and permissions, and they are budgeted separately. And there is a window between arrival and verdict whose lower bound is the detector schedule and whose actual size also depends on execution time, queueing and behaviour under resource pressure. I did not measure its distribution, so nothing here calls the result near real time.
The rewrite cost sits here too, and the transition plan (pinned at the tag, live page) is blunt about it: custom 4.x rules and decoders in XML cannot be migrated to 5.x, and the required detection content has to be recreated through content management. Copying files into the manager installation is explicitly not a path either.
Severity is the trap inside that work. rule.level becomes wazuh.rule.level, and the type changes with the name: an integer from 0 to 16 becomes one of informational, low, medium, high, critical. Wazuh publishes no mapping from seventeen values onto five, and inventing one privately is how notification thresholds and dashboard filters quietly stop meaning what they meant. Before any of that, inventory what is actually alive: in an estate that has accumulated rules for years, some of them have never fired, and deleting those is cheaper than rewriting them.
If your development loop for rules runs in a terminal, budget for rebuilding it. wazuh-logtest does not exist in the 5.0 installation, so testing a decoder against a log line on the manager itself is no longer possible; that work moved into the interface and the API.
Active response is a rewrite, not a port
Custom active response scripts do not survive the move, and the changes are structural rather than cosmetic.
Everything in this section comes from the guide to migrating active response scripts. Trigger conditions leave the manager’s <active-response> block and become a monitor of the Active response type in the Alerting plugin. ar.conf no longer exists: the script’s name, executable, type and timeout now travel inside the wazuh.active_response object of every message, and a stateful script reads its own timeout from there. The command values changed too, from add and delete to enable and disable, so a script that switches on that field receives a value it does not know. Whether it skips the action or exits with an error depends on how its unknown-command branch is written. Finding data no longer arrives under parameters.alert but through wazuh.active_response plus top-level WCS fields such as source.ip, user.name, wazuh.rule.id and file.path.
Two items cut the other way. Creating or changing an active response configuration from the dashboard takes effect without restarting the manager or the agent. And agent restart and reload moved out of active response into the Control module endpoints, so a script built around restart-wazuh needs redesigning rather than editing.
I did not measure the path from finding to executed action, so nothing here claims anything about response latency or retries.
What actually moves, and what you rebuild
Migration hides four operations with four different prices.
Custom dashboards, visualizations, saved searches and index patterns export from 4.x and import into 5.x (dashboard migration, pinned at the tag). The default 4.x objects must not be imported: they overwrite the 5.x defaults and bring incompatible visualizations with them. Even for your own objects, import is the start rather than the end, because index patterns and field names still have to be re-pointed at WCS afterwards.
Historical indices move by snapshot, with one hard prerequisite: the source deployment has to run 4.4.0 or later (indexer migration, pinned at the tag). Restored indices keep their 4.x mappings, stay separate from the 5.x indices and data streams, and receive no new data. You end up with two schema worlds and two query dialects rather than one continuous history.
Users, roles, role mappings, authentication providers and security settings have no migration path at all. They are recreated by hand, and then verified separately - that the recreated roles reference permissions that exist and the mappings reference users and roles that exist.
Which brings up rollback, and my own earlier phrasing was too absolute. There is no in-place downgrade, but that is not the same as no way back. The migration plan explicitly requires keeping the 4.x environment running until the new one is validated, so rollback means pointing agents and data sources back at the retained 4.14.7. As long as you have not decommissioned the old environment, a way back exists.
The fleet contract
Agent transport was rewritten, and its contract lives in the sources of the build under test (the module reference at tag v5.0.0-beta5), which for a beta is steadier ground than a page that changes daily. A 5.0 agent talks to the manager over HTTPS on port 1517: POST /enroll to register, POST /stateless for events, POST /stateful for inventory. All of them sit under a configurable path prefix, /wazuh-manager/ by default.
Enrollment and everything after it authenticate differently, and the distinction matters. /stateless and /stateful carry a per-agent bearer token the agent signs with its key from client.keys. /enroll cannot: the agent is there to obtain that key and has no entry yet. Registration authenticates through a separate listener-level credential instead, which keeps it the one endpoint where the decision about who joins the fleet is actually made.
The stand agrees. The manager answers under that prefix, and the connection negotiates TLS 1.3 with TLS_AES_256_GCM_SHA384. That is worth one qualification: the manager certificate is self-signed, and a 5.0 agent logs TLS verification is DISABLED (verify_mode=none) on its first run. A modern protocol on the wire and a verified peer are separate properties, and only the first is on by default. The enrollment section changed in the same direction: 4.14.7 carries a classic OpenSSL cipher string and an ssl_auto_negotiate option that allows only TLS 1.2 by default, while 5.0 drops that option entirely and lists TLS 1.3 suites. Version negotiation itself has not gone anywhere: TLS still works by agreeing on a version both sides support, and 1.3 does not forbid that. What changed is which versions Wazuh is willing to support. The stand shows it directly: forcing TLS 1.2 against port 1517 is rejected with alert protocol version, while port 1515 on 4.14.7 accepts the same connection and negotiates ECDHE-RSA-AES256-GCM-SHA384. Refusing the older protocol is a property of the Wazuh configuration, not of the protocol. Shared-password enrollment is also on by default in 5.0, with the password file generated for you, where the 4.14.7 switch is off.
I got the mixed-fleet consequence backwards at first, so it is worth stating carefully. The mechanism reads that the legacy AES channel on 1514 starts only when a <legacy> block is present inside <remote>, which sounds like accepting 4.x agents is a deliberate act. It is the opposite. The shipped wazuh-manager.conf already contains that block, enabled, and my beta5 manager listens on 1514, 1515 and 1517 at once. A mixed fleet is what you get out of the box; refusing one is the decision that takes configuration.
A 4.14.7 agent does connect to the 5.0 manager over that legacy channel and takes its place in the key file beside the 5.0 agent. Its events arrive: rootcheck, SCA and authentication documents all showed up. Its state produced nothing across the window I watched. The state indices held 1165 documents covering file integrity, packages, users, interfaces and ports, and every one of them belonged to the 5.0 agent.
That agent had been running for about five minutes, and state synchronization may need longer, so I record this as an absence across my observation window rather than as proof of impossibility. The direction matches the agent migration guide, pinned at the tag, which warns that FIM, SCA, inventory, active response and vulnerability detection are not fully supported until an agent is upgraded. For planning, the useful phrasing is the documentation’s own: those modules are not fully supported until the agent is upgraded. On my stand that showed up as an inventory with no trace of the 4.x host over the window I watched. Connected and equivalent are different states, and a mixed fleet is a transition window rather than a place to live.
The tooling contract
The manager’s executable set went from 29 files to 16: fourteen removed, one added, ten renamed, five kept their names. Gone are manage_agents, agent_control, clear_stats, wazuh-agentlessd, wazuh-maild, wazuh-csyslogd, wazuh-integratord, wazuh-regex, wazuh-reportd, both log test binaries, and wazuh-logcollector, wazuh-syscheckd and wazuh-execd. That last group did not lose its function; it lost its host. In 4.14.7 the manager registers itself as agent 000, so it carries an agent’s modules. On the 5.0 stand there is no 000 at all and the first enrolled agent is 001. The one addition is wazuh-manager-service-control. Ten existing executables acquired the wazuh-manager- prefix, and not all of them are daemons: the control and keystore utilities were renamed alongside them. Five more, such as agent_groups and cluster_control, kept the names they had.
Then a cluster of renames, each trivial alone and collectively fatal to anything scripted. The manager moved from /var/ossec to /var/wazuh-manager, its configuration is wazuh-manager.conf, and the root element inside it is wazuh_config rather than ossec_config. The agent stayed at /var/ossec with ossec.conf and the old daemon names, so a host running both now carries two naming schemes at once.
How finished the beta is
Nobody is proposing 5.0 Beta 5 for production, but it is fair to ask whether it is ready for a serious pilot.
The official Docker deployment does not start as shipped. The single-node compose file mounts nine certificate files from a config directory, and neither that directory nor any certificate tooling exists in the repository - not at the beta tag and not on the live branch. The README at that same tag still describes a certificate creator and a single-node README that are also absent. I brought the stand up by taking the node definition and the generator from the 4.14.7 checkout and rearranging the output into the layout the new compose expects. That is a workaround I can document, not a procedure I would recommend.
Two dates are worth separating here. Beta 5 itself was published on 1 September 2026, a prerelease with a date like any other. What has no date is GA: the 5.0.0 release notes are still titled 5.0.0 Release notes - TBD. Meanwhile the live documentation moves daily: in the three days after the beta was published it gained rewritten manager and agent sections and a revised agent configuration schema in the migration guide. For a while two pages disagreed with each other, one saying the legacy services stay enabled by default and another saying the channel starts only when the block is enabled. The shipped configuration reconciles them, but the reader has to find that out alone.
That is why this piece cites a tag wherever a claim can be pinned to v5.0.0-beta5, with the live page beside it as the readable address. Two links stayed live-only, deliberately. The guide to migrating active response scripts does not exist at the tag at all, and the indexer connector page does exist there but without the buffering warning, which was added afterwards. Two facts that whole sections rest on live only in the mutable branch, and saying so is more honest than pinning a link that does not contain them.
The practical consequence is a sourcing rule rather than a complaint. Pin historical claims to a tag, and verify behaviour against the build you actually intend to deploy, because the page you read this morning may not say the same thing tonight.
What genuinely improved
The losses in this piece are evidenced better than the gains, and that is a bias of method rather than of opinion: a failure can be measured in minutes, while the value of a schema shows up over months. So here are the gains stated plainly, with the measured ones separated from the claimed ones.
Measured on the stand. An event now has a predictable shape. The 39 fields of that SSH document sit at documented ECS locations instead of wherever an integration chose to put them, and the decoder chain travels inside the document, so any event can say what parsed it. Routing by integration category means a query about one class of source no longer has to know rule names. And separating events from findings means hunting runs across everything that arrived, not only across what somebody had already written a rule for. The full stream is reachable in 4.x too, but by a separate road: archiving has to be enabled and archives.json shipped (event logging, pinned at tag v4.14.7), or an event that matched nothing never reaches the analyst. The difference is that in 5.0 the full stream is part of the primary model rather than a second pipeline you remember to switch on.
Claimed by the documentation and not measured by me. Strict schema validation rejects an invalid field when content is activated rather than letting it become a silently dead detection. Content promotes along draft to test to custom, with the Log test tool validating in test and standard staying read-only and synchronized from CTI (spaces, pinned at the tag). That is an ordinary pre-production workflow for detection content, and the file-based model in 4.x had nothing equivalent.
The boundary on that gain is worth naming. A Sigma-compatible rule is not a portable rule: it still depends on WCS field names, the Wazuh extensions, the integration category and a configured detector. What improves is that the semantics are written in a form other tools already read.
Known Beta 5 problems as of 7 September 2026
This is a dated snapshot and it should be re-checked, because betas move.
The project’s own end-to-end test tracker for Beta 5 is a live document that changes during the day. In the snapshot I saved on 7 September 2026 at 12:12 UTC it holds 38 suites: 25 green, 12 red, one yellow and none without a result (tracker, last edited the same day at 09:23 UTC). The red ones include deployment on Docker, on Kubernetes and with Ansible, vulnerability detection, IOCs, agent internal limits, docker_listener, wodle_command and four cloud integrations. The timestamp is not decoration: three hours before that snapshot the split was different, and the earlier state can no longer be recovered from the link.
One open defect matters more than the rest for anyone evaluating detection. When the indexer’s search backpressure service runs in enforced mode it cancels the search tasks that doc-level detection monitors rely on; the monitor fan-out fails with all shards failed, and the documents in that batch are never evaluated - no finding, and nothing surfaced to the operator. In the reported case 70,000 documents went unevaluated inside a 1.4-second window (defect, opened 2 September, updated 4 September). That number belongs to the reporter’s stand under memory pressure with a 1940 MB heap and should not be generalized. The failure mode should be taken seriously all the same: a silent hole in detection is the worst kind there is.
It lines up with something I saw independently. On my stand, with a 1 GB heap, the indexer answered the manager with HTTP 429 and a circuit_breaking_exception while reading remote settings. That is a property of lab sizing rather than of the product. I cannot claim 5.0 is more memory-sensitive than 4.x, because I never compared consumption under matched load. What is established is narrower and sufficient: indexer memory and availability now sit on the critical path of detection, where in 4.x detection did not live in the indexer at all.
There is also a defect that explains why a stand can look ready before it is: the dashboard container’s healthcheck reports healthy as soon as the HTTP server answers, including when it answers with the “not ready yet” page (defect). The same healthcheck sits in the single-node compose I used.
Three maps for planning
Three tables assembled from the documentation and from the stands. The tag in brackets says where a row comes from: measured means I saw it on a stand, documented means it comes from the documentation and I did not verify it myself.
Where each function runs
| Function | 4.14.7 | 5.0.0 Beta 5 |
|---|---|---|
| Event collection | agent (measured) | agent (measured) |
| Decoding and normalization | manager, analysisd (measured) | manager, normalization engine (measured) |
| Rule matching | manager, before shipping (measured) | indexer, scheduled detector (measured) |
| Geo, ASN and IOC enrichment | integrations and rules (documented) | normalization engine, ordered list (documented) |
| Where the verdict lands | alerts.json, then the index (measured) | a separate findings stream (measured) |
| FIM and inventory state | synchronized with the server (documented) | local to the agent, then state indices (measured) |
| Delivery to storage | Filebeat (measured) | indexer connector as a library (measured) |
| Notifications | wazuh-maild on the manager (documented; only the binary inventory was measured) | Notifications and Alerting plugins (documented) |
| Active response | manager configuration (documented) | a monitor in the Alerting plugin (documented) |
| Content management | files on the manager (measured) | content manager as an indexer plugin (documented) |
Breaking change, action, owner
| Change | Action | Owner |
|---|---|---|
| XML rules and decoders do not migrate | inventory, delete the dead, rewrite the rest (documented) | detection engineering |
| Severity changes type from 0 to 16 into five categories | revisit thresholds, filters and escalation (documented) | detection engineering and SOC |
| Events and findings are separate populations | budget volume, retention and access separately (measured) | platform |
wazuh-alerts-* replaced by category streams | rebuild index patterns, ISM policies and exports (measured) | platform |
Manager moved to /var/wazuh-manager | update scripts, backups and monitoring (measured) | operations |
Configuration root element is now wazuh_config | update configuration generation and parsing (measured) | operations |
Manager log is now wazuh-manager.log | update log collection and parsing (measured) | operations |
wazuh-logtest is gone | rebuild the rule development loop (measured) | detection engineering |
| The documentation states that a manager restart discards the connector buffer (documented); across three runs of that sequence, 0 of 100 confirmed agent writes were indexed afterwards (measured) | write the service order into the runbook | operations |
| Active response scripts change contract | rewrite message and command parsing (documented) | automation |
| Users and roles do not migrate | recreate and verify the references (documented) | security |
| Snapshots require the source to run 4.4.0 or later | check the version before planning the move (documented) | platform |
Old and new
| 4.14.7 | 5.0 Beta 5 |
|---|---|
/var/ossec for the manager | /var/wazuh-manager; the agent stays in /var/ossec (measured) |
manager ossec.conf | wazuh-manager.conf (measured) |
root element ossec_config | wazuh_config (measured) |
/var/ossec/logs/ossec.log | wazuh-manager.log (measured) |
alerts.json as where an alert lives (measured) | per the documentation a connector buffer in memory, then the event stream; what I measured is only that after a manager restart the events never appeared in the indexer |
wazuh-alerts-* | wazuh-events-v5-<category> and wazuh-findings-v5-<category> (measured) |
rule.level, integer 0 to 16 | wazuh.rule.level, five categories (documented) |
rule.description | wazuh.rule.title (documented) |
agent.name, agent.id | wazuh.agent.name, wazuh.agent.id (documented) |
srcip, srcuser in the decoder | source.ip, user.name (measured on one example) |
| agent events on 1514, enrollment on 1515 | HTTPS 1517, with 1514 and 1515 retained (measured) |
ar.conf for response scripts | the wazuh.active_response object in the message (documented) |
| OpenSearch 2.19.5 behind a 7.10.2 mask | OpenSearch 3.6.0, unmasked (measured) |
Who should do what
| Profile | Call | Reason |
|---|---|---|
| Production on 4.14.7 | Stay, start the XML inventory | Rules do not migrate, and rollback means returning agents to a retained 4.14.7 rather than downgrading 5.x |
| New deployment today | 4.14.7, or wait for GA | No announced GA date, and a Docker deployment that does not start without recreated tooling |
| Lab with no legacy content | Pilot now | Schema, Sigma and content lifecycle evaluate cleanly without migration debt |
| Large agent estate | Plan in waves | In mixed mode events from 4.x agents arrive; their state did not appear within the window I watched |
| Estate on retired operating systems | Keep those hosts on 4.x | Several platforms are dropped in 5.x |
| Team that wants Sigma and one schema | Prepare a pilot | This is the strongest part of 5.0, and it is paid for in rewritten content |
What I tested and what I did not
Tested on the stands: outage behaviour with and without a manager restart on both versions, one log line through both pipelines, a 4.14.7 agent against a 5.0 manager and what its data covers, the port and TLS parameters of the new transport, the stream and index inventory, and the executable and configuration inventory.
Tested in part, and labelled as partial: the mixed fleet. I established that a 4.14.7 agent connects to a 5.0 manager and that its events arrive, while its state did not appear during a short window. I did not produce the feature matrix - FIM, SCA, vulnerability detection, active response and agent upgrade each measured separately - and one observation must not be dressed up as a feature matrix.
Not tested, and therefore not claimed: event-to-finding latency, active response end to end, restoring 4.x snapshots into 5.x, importing dashboard saved objects, behaviour while the CTI service is unreachable, AI Assistant data handling, and resource consumption under matched load. Those stay open.
My reading is that 5.0 delivers what 4.x could not: one schema, rules expressed in a Sigma-compatible form, and a managed lifecycle for detection content. Portable is not the word for those rules, because they still depend on WCS field names, the Wazuh extensions, the integration category and a detector; what improves is that the semantics are written down in a form other tools already understand. None of that is in dispute. What is in dispute is the word upgrade. Moving a working 4.14.7 installation is a project with its own backlog - rewrite the rules, re-point and repair the dashboards you keep, re-teach the runbook, update everything scripted against the old paths and names, and learn before an incident that a manager must not be restarted while its indexer is down. Time that project by how many detections you would have to prove again on the same corpus, not by how good the feature list reads.
Related reading on this blog: static analysis for Wazuh decoders, static analysis for rules, working with mutable documentation through RAG and a local model inside the Wazuh dashboard.