Introduction
In Part 1 we connected AWS Bedrock Claude to the Wazuh Dashboard chat via ML Commons. That approach works well for analysts working inside the Wazuh UI. In this part we open a second channel: Model Context Protocol (MCP), which allows any compatible client - Claude Desktop, custom applications, CI pipelines - to query Wazuh Indexer data through a standardized tool interface.
We will add opensearch-mcp-server-py (the official OpenSearch MCP server, Apache 2.0 license) as a fourth service in the same docker-compose.yml and expose it on port 9900. This service speaks MCP Streamable HTTP and wraps the Wazuh Indexer REST API into ready-made tools: SearchIndexTool, LogPatternAnalysisTool, DataDistributionTool and others.
Why not the built-in OpenSearch MCP server? The built-in endpoint
/_plugins/_ml/mcpwas introduced in OpenSearch 3.0. Wazuh Indexer 4.14.x runs on OpenSearch 2.19.x and will not receive a backport of this feature until 3.x. The standalone Python server works with any OpenSearch version.
What is Model Context Protocol (MCP)
Model Context Protocol is an open standard by Anthropic for connecting LLMs to external data sources and tools. MCP defines a unified interface between a client (Claude Desktop, IDE, custom application) and a server (any data source).
Key concepts:
- MCP server - a process that exposes a set of tools. Each tool has a name, description and JSON Schema for input parameters. In our case the
opensearch-mcp-server-pyserver wraps the OpenSearch REST API into 11 tools - MCP client - an application that connects to the server and invokes tools on behalf of the LLM. Claude Desktop, Claude Code, Amazon Q Developer CLI are examples of clients
- Transport - the communication method between client and server. Supported options are
stdio(local process) andstream(SSE/HTTP over network)
The LLM does not call APIs directly. Instead it receives a list of available tools with descriptions, constructs a call with the required parameters, and the client forwards it to the server and returns the result. This allows a single MCP server to serve any compatible client without integration code.
Architecture

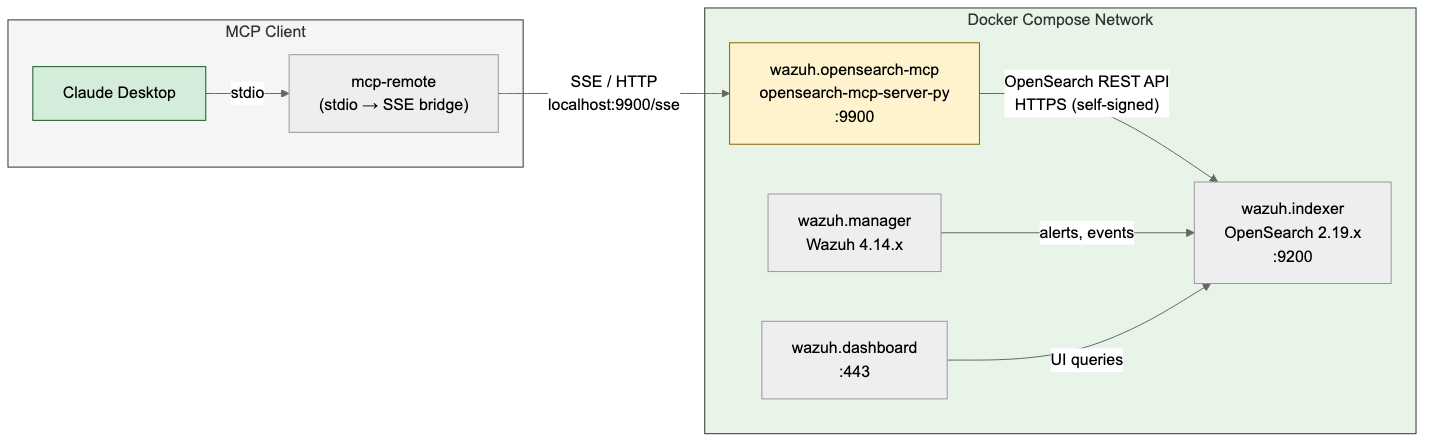
Claude Desktop launches mcp-remote as a child process via stdio. mcp-remote establishes an SSE connection to wazuh.opensearch-mcp on port 9900. The MCP server translates tool calls into REST API requests to Wazuh Indexer (OpenSearch 2.19.x) over HTTPS with self-signed certificates inside the Docker bridge network.
Adding the MCP Service to Docker Compose
Create the Dockerfile directory:
mkdir -p wazuh-docker/single-node/config/mcp
Create wazuh-docker/single-node/config/mcp/Dockerfile:
FROM python:3.12-slim AS builder

RUN pip install --no-cache-dir --prefix=/install opensearch-mcp-server-py

FROM python:3.12-slim

LABEL maintainer="pyToshka" \
      description="OpenSearch MCP Server for Wazuh Indexer"

RUN apt-get update && \
    apt-get install -y --no-install-recommends curl && \
    rm -rf /var/lib/apt/lists/* && \
    groupadd -r mcp && useradd -r -g mcp -d /app -s /sbin/nologin mcp

COPY --from=builder /install /usr/local

ENV OPENSEARCH_SSL_VERIFY="false" \
    OPENSEARCH_ENABLED_CATEGORIES="core_tools,skills_tools"

EXPOSE 9900

USER mcp

HEALTHCHECK --interval=30s --timeout=5s --retries=3 CMD curl -sf http://localhost:9900/health || exit 1

ENTRYPOINT ["python", "-m", "mcp_server_opensearch", \
            "--transport", "stream", "--host", "0.0.0.0"]
Dependencies are installed at build time, so the container starts instantly without re-running pip install on every restart.
Add the following service to the existing docker-compose.yml after the wazuh.dashboard service:
  wazuh.opensearch-mcp:
    build: ./config/mcp
    hostname: wazuh.opensearch-mcp
    restart: always
    ports:
      - "9900:9900"
    environment:
      - OPENSEARCH_URL=https://wazuh.indexer:9200
      - OPENSEARCH_USERNAME=${INDEXER_USERNAME}
      - OPENSEARCH_PASSWORD=${INDEXER_PASSWORD}
    depends_on:
      - wazuh.indexer
The server runs in single mode and receives all settings via environment variables. OPENSEARCH_SSL_VERIFY=false and OPENSEARCH_ENABLED_CATEGORIES are set in the Dockerfile by default. OPENSEARCH_SSL_VERIFY=false disables certificate verification inside the Docker network where self-signed certs are used. Traffic does not leave the docker-compose bridge network.
Build and start:
docker compose up -d --build
docker compose ps
Service Verification
Check that the health endpoint responds:
curl -sf http://localhost:9900/health
Get the list of available tools via the MCP endpoint:
curl -s -X POST http://localhost:9900/mcp/ \
  -H "Content-Type: application/json" \
  -H "Accept: application/json, text/event-stream" \
  -d '{"jsonrpc":"2.0","id":1,"method":"tools/list","params":{}}' \
  | grep '^data: ' | sed 's/^data: //' \
  | jq '[.result.tools[].name]'
Expected response:
[
  "DataDistributionTool",
  "LogPatternAnalysisTool",
  "ListIndexTool",
  "IndexMappingTool",
  "SearchIndexTool",
  "GetShardsTool",
  "GenericOpenSearchApiTool",
  "ClusterHealthTool",
  "CountTool",
  "MsearchTool",
  "ExplainTool"
]
Connecting Claude Desktop
Create or update the Claude Desktop configuration file.
macOS:
"$HOME/Library/Application Support/Claude/claude_desktop_config.json"
Linux:
~/.config/claude/claude_desktop_config.json
Claude Desktop does not support direct connection to a remote MCP server via URL. To communicate with the streaming server, mcp-remote is used - an npm package that acts as a bridge between Claude Desktop’s stdio interface and the remote SSE endpoint.
Add the wazuh server to the mcpServers section:
{
  "mcpServers": {
    "wazuh": {
      "command": "npx",
      "args": [
        "-y",
        "mcp-remote",
        "http://localhost:9900/sse"
      ]
    }
  }
}
The
-yflag automatically confirms the installation ofmcp-remoteon first launch. Node.js is required.
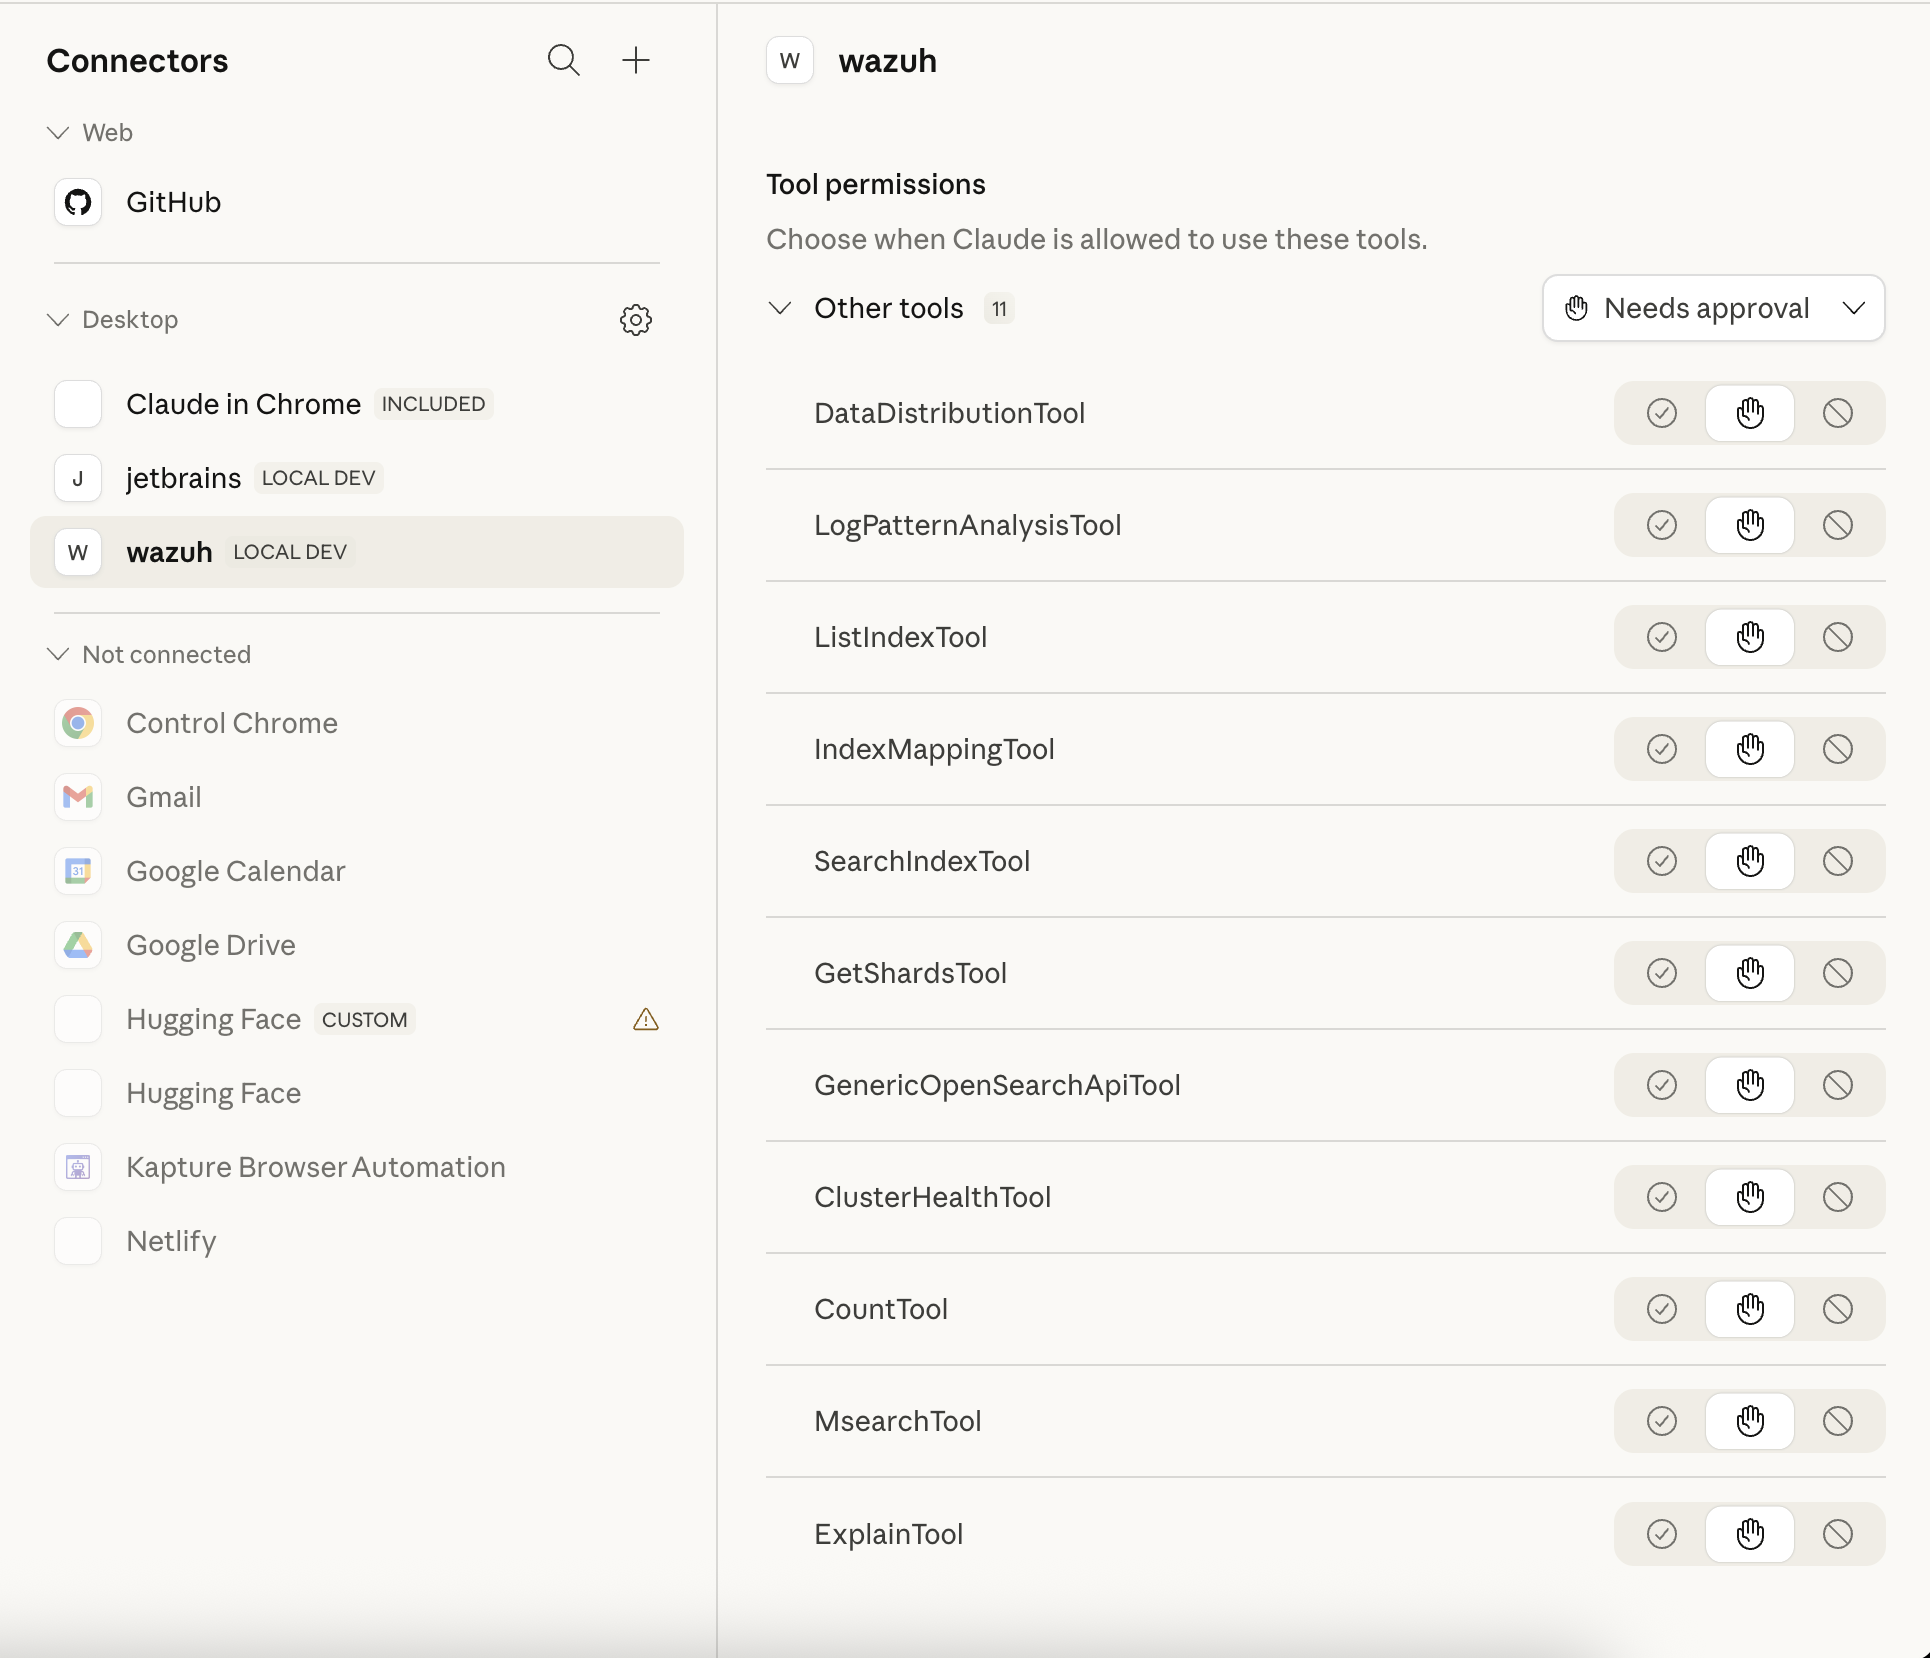
Restart Claude Desktop. The wazuh server will appear in the Connectors section labeled LOCAL DEV with all 11 tools:

Using MCP Tools from Claude Desktop
Once connected, you can ask Claude Desktop questions that invoke tools querying live Wazuh data.
Listing Indices
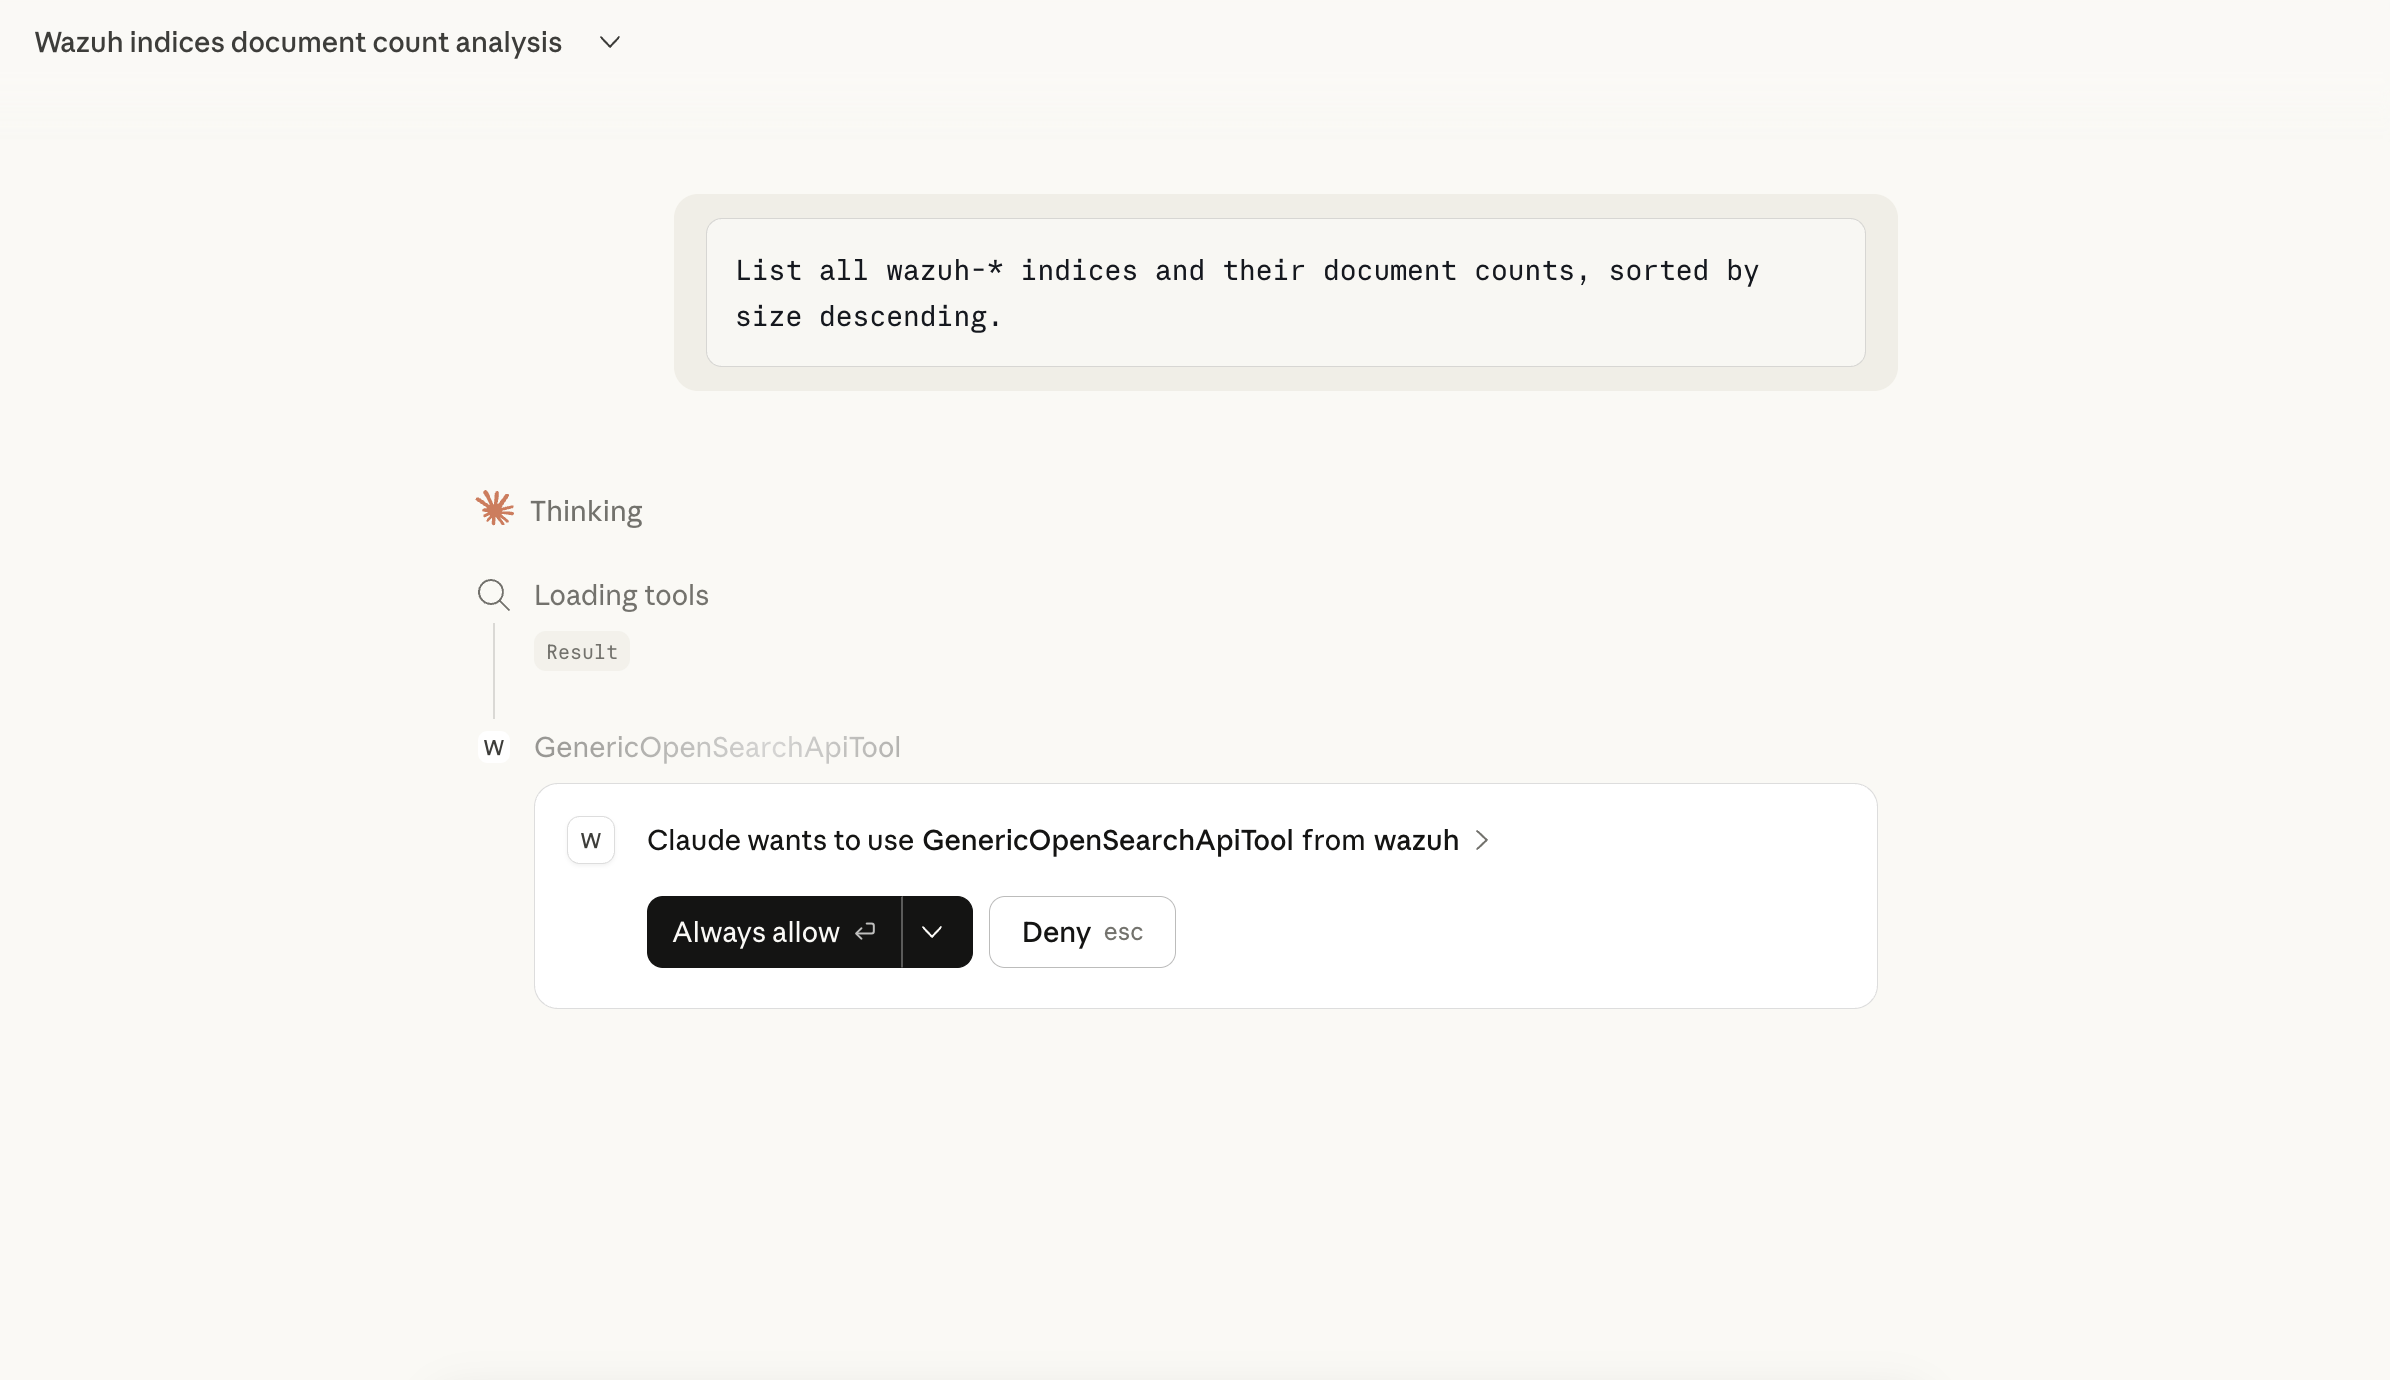
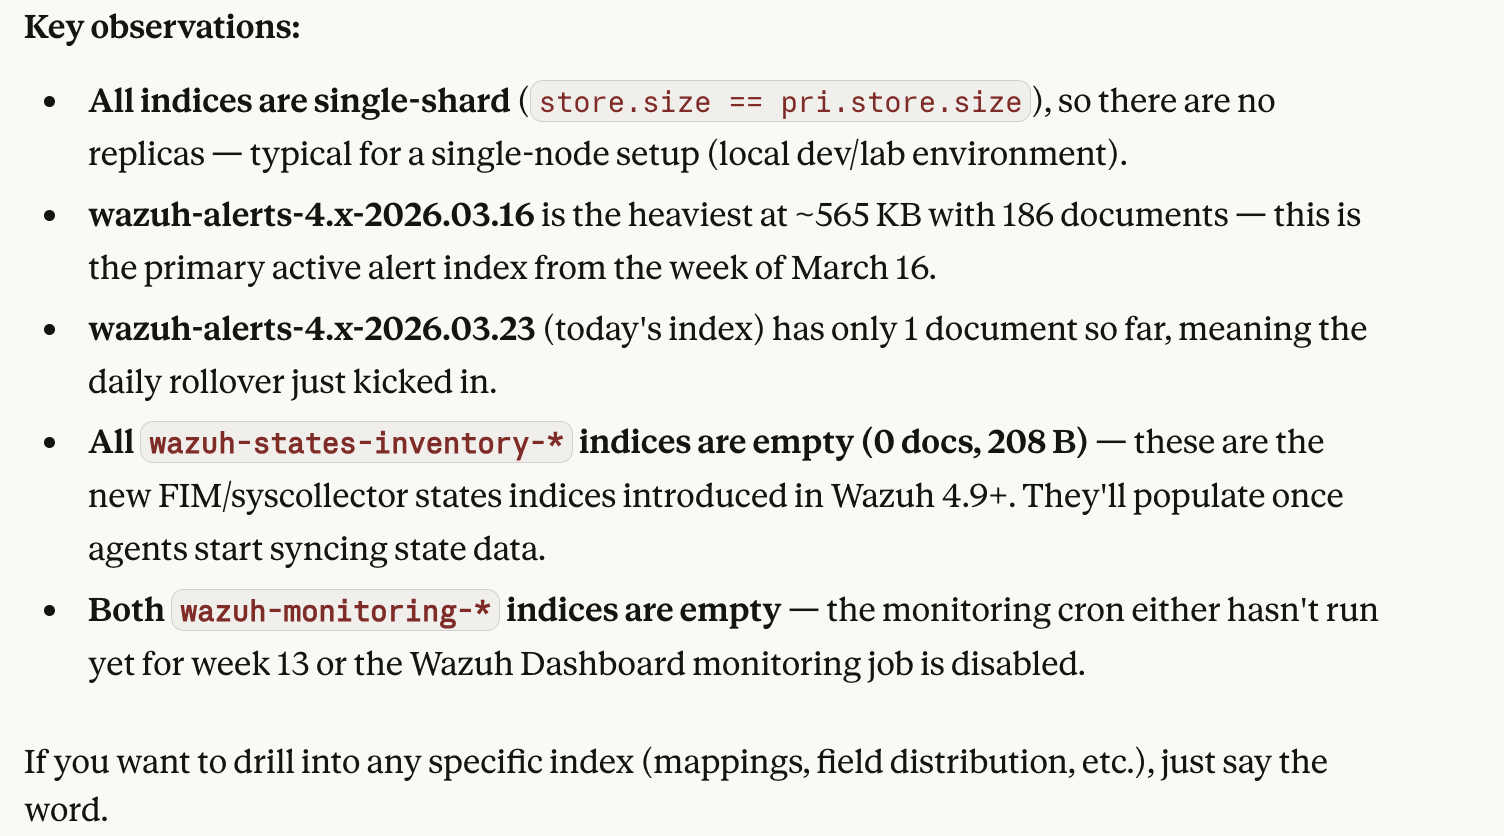
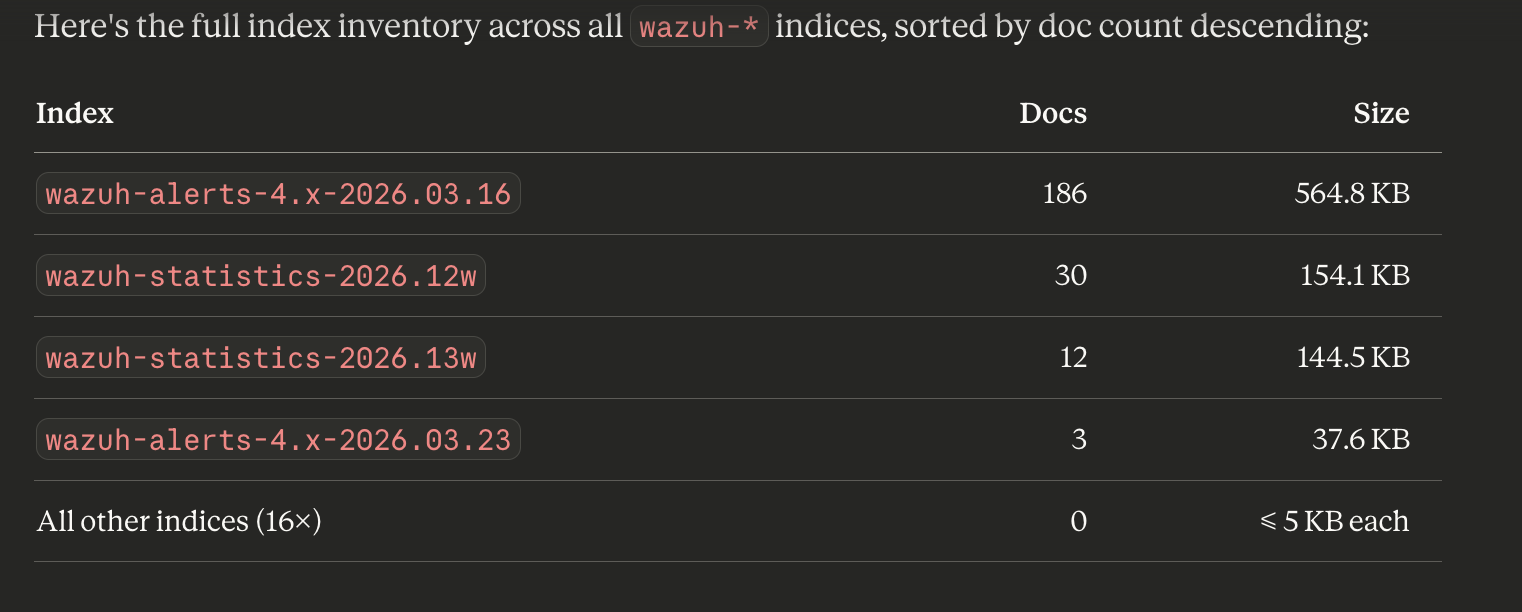
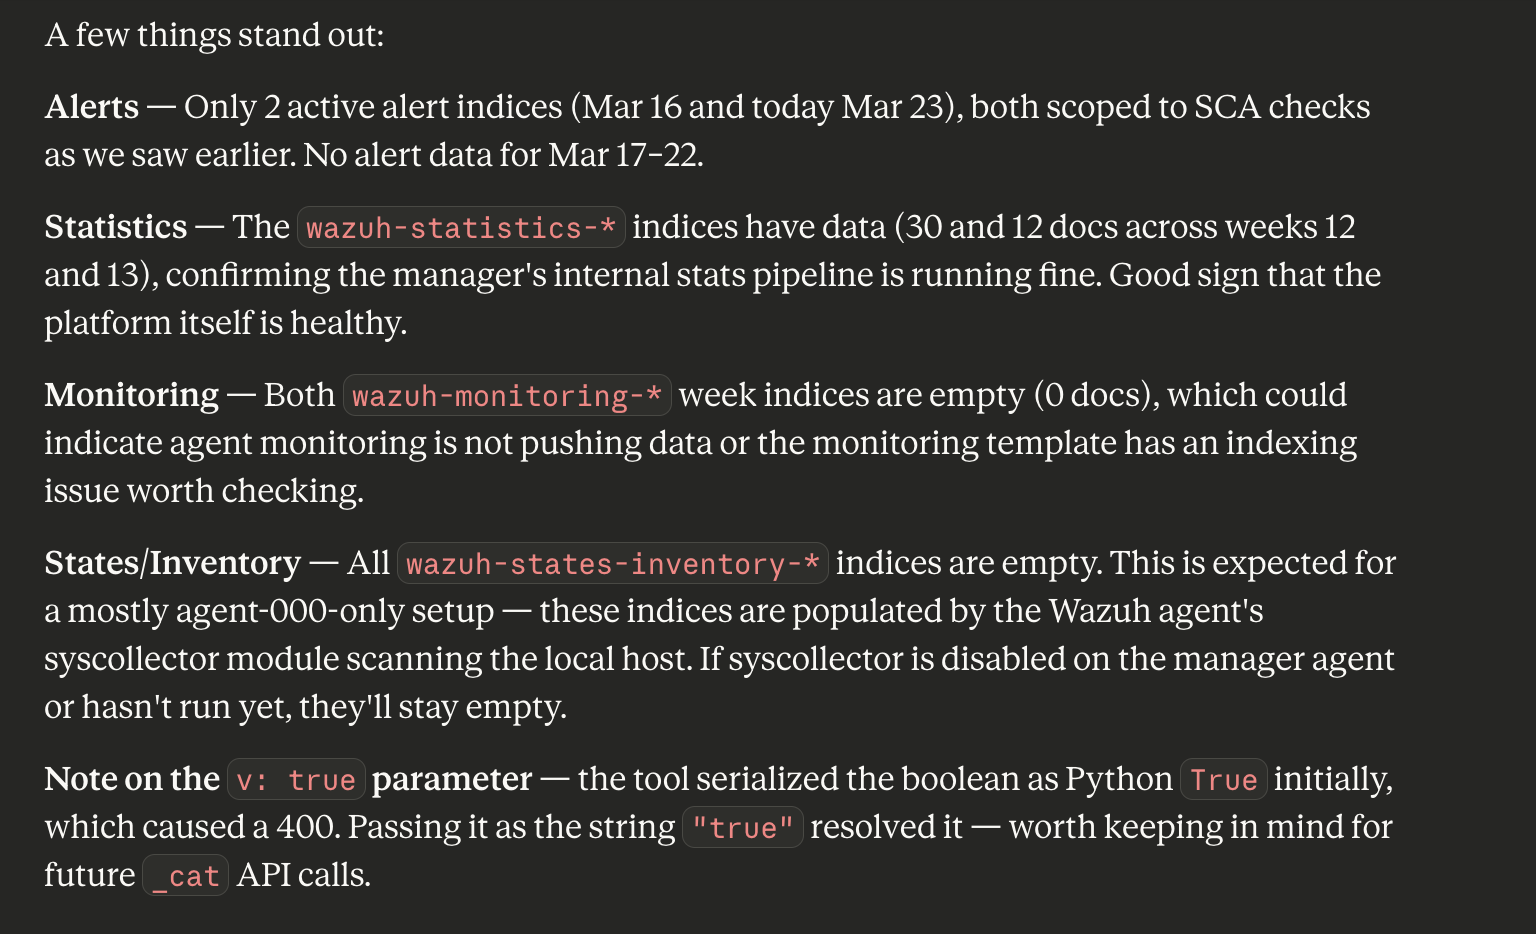
List all wazuh-* indices with document counts, sorted by size.
On the first tool invocation Claude Desktop will request permission. Click Always allow to automatically approve subsequent calls to the wazuh server.

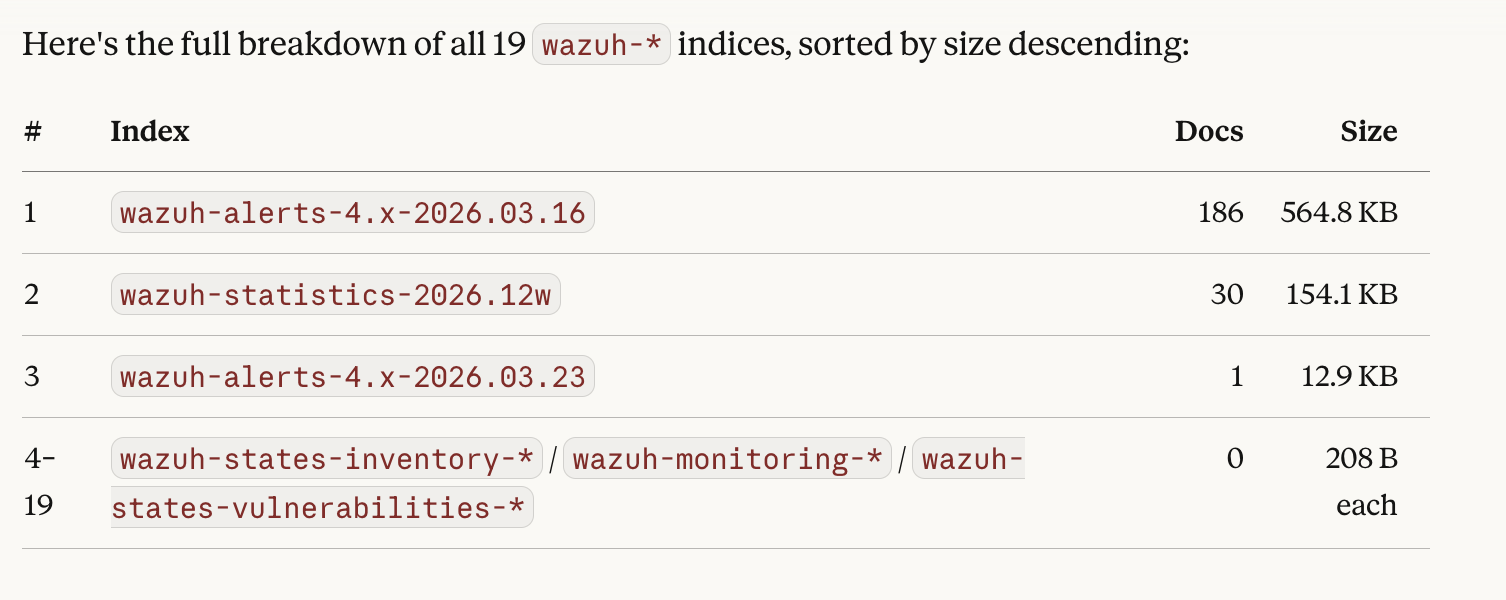
Claude will invoke ListIndexTool and format the response as a readable table:


Searching Alerts
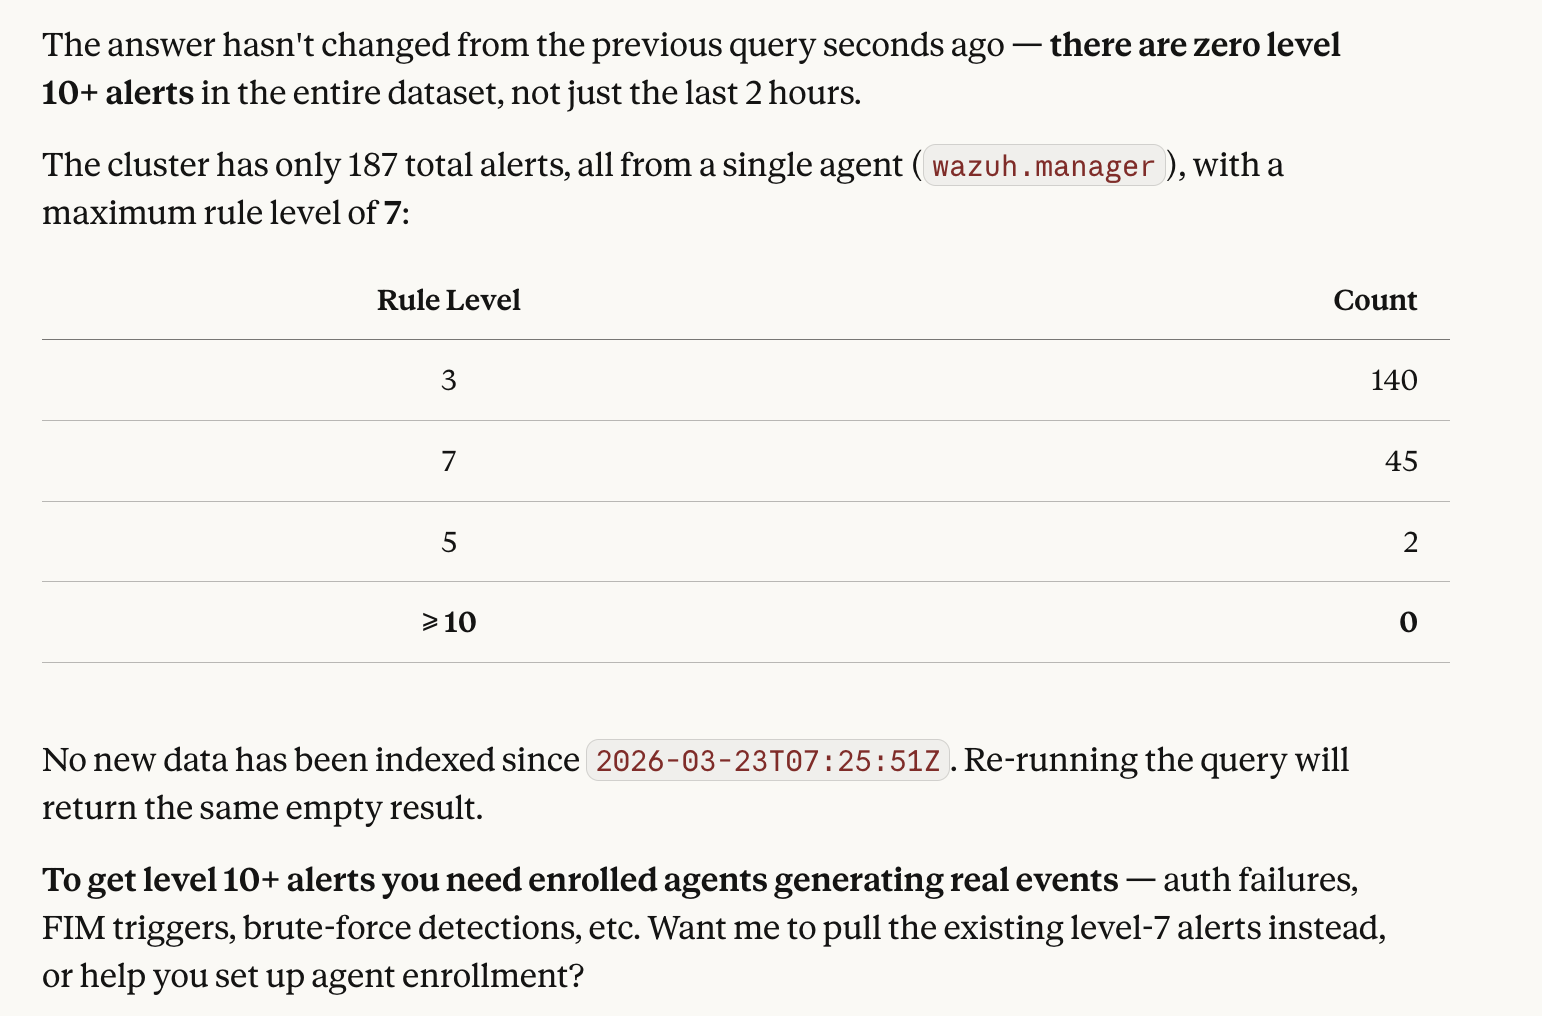
Find the last 50 alerts with rule level 10 or higher from the past 2 hours.
Return agent name, rule description, source IP, and timestamp.
This triggers SearchIndexTool with an automatically constructed Query DSL body for the wazuh-alerts-4.x-* index.

Log Pattern Analysis
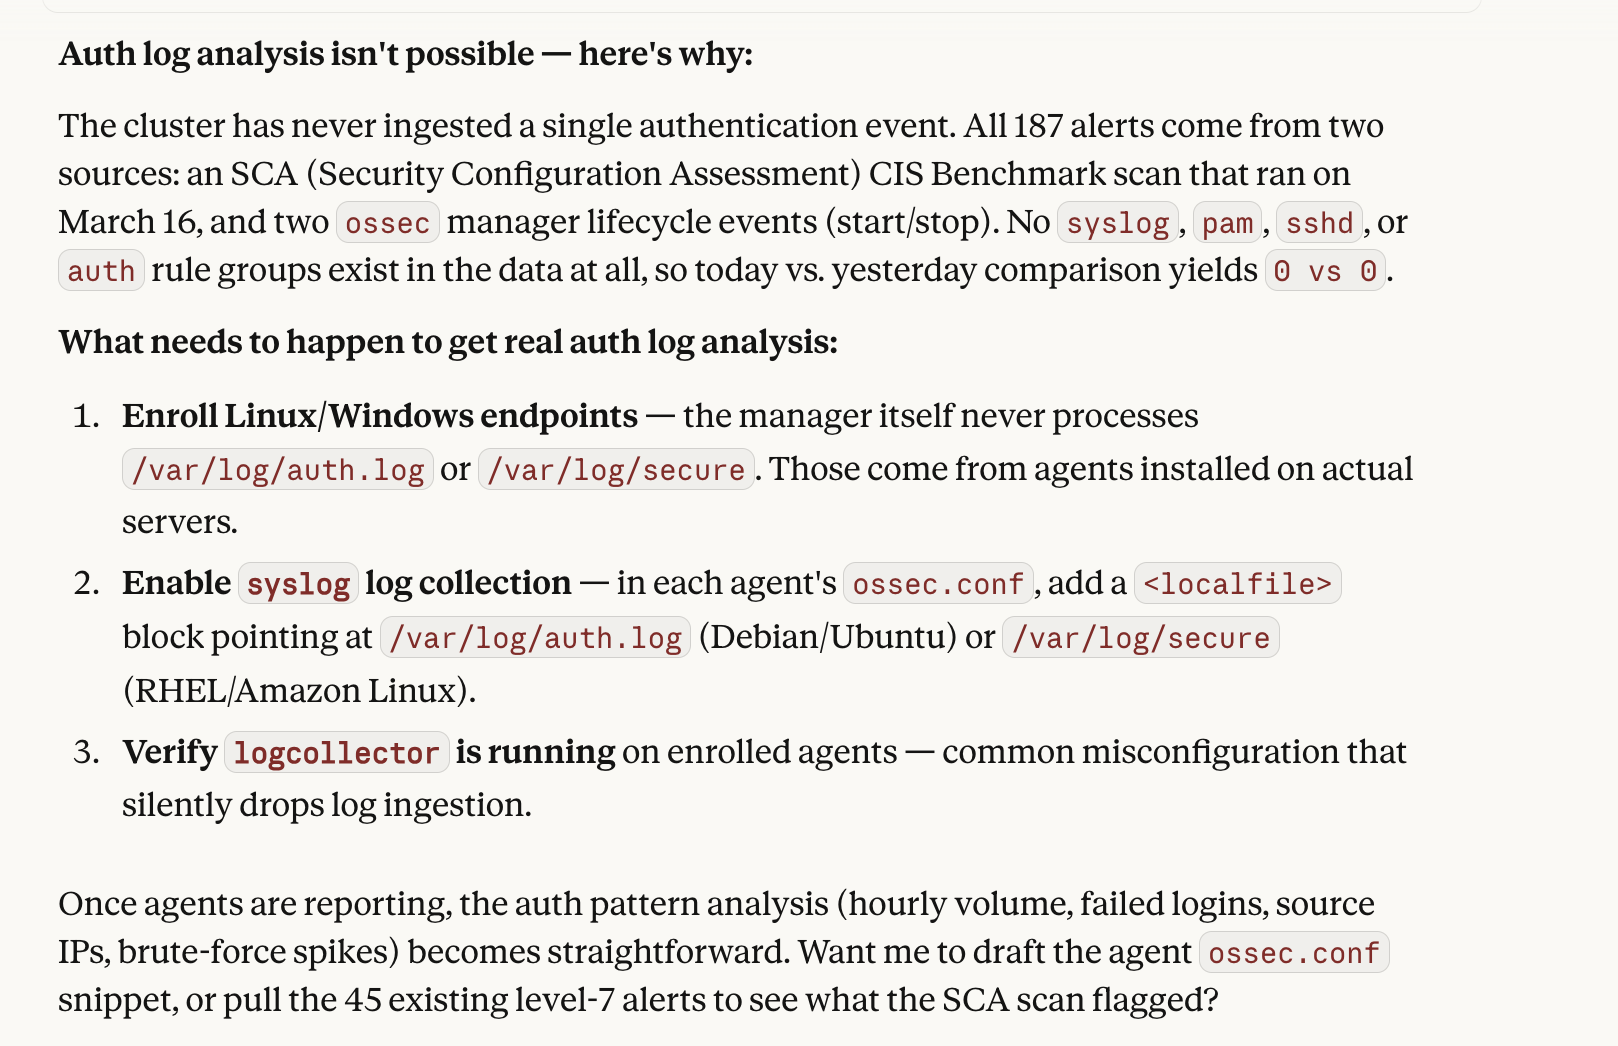
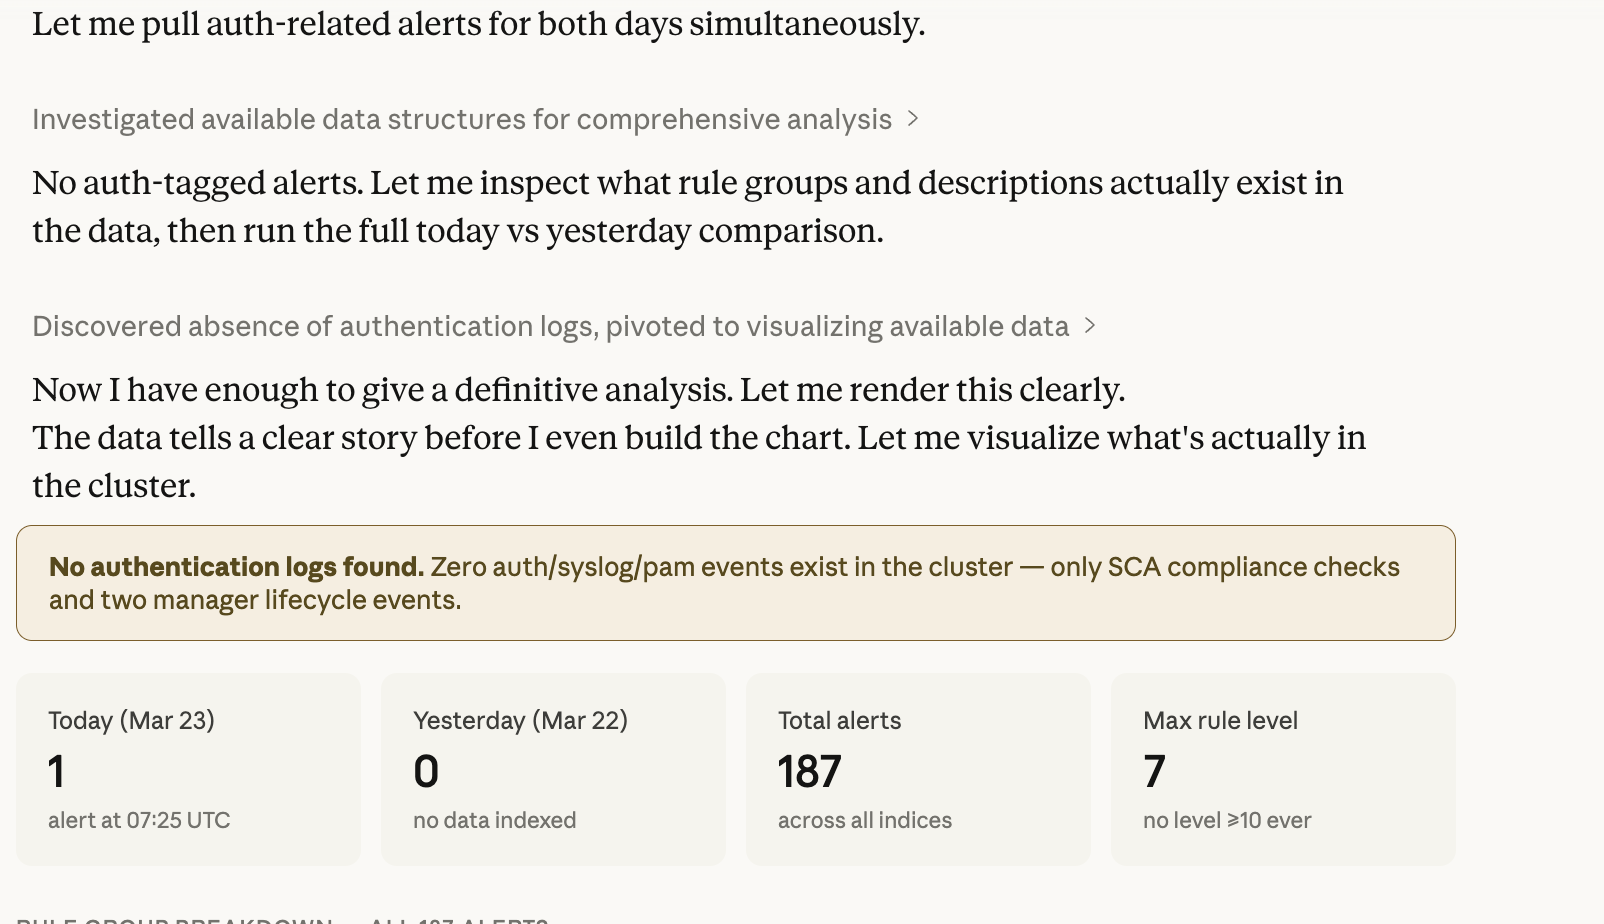
Analyze authentication log patterns in wazuh-alerts-4.x-* for today.
Compare against yesterday as a baseline and highlight anomalous spikes.
LogPatternAnalysisTool performs a baseline vs current period comparison and returns detected pattern deviations.


Field Value Distribution
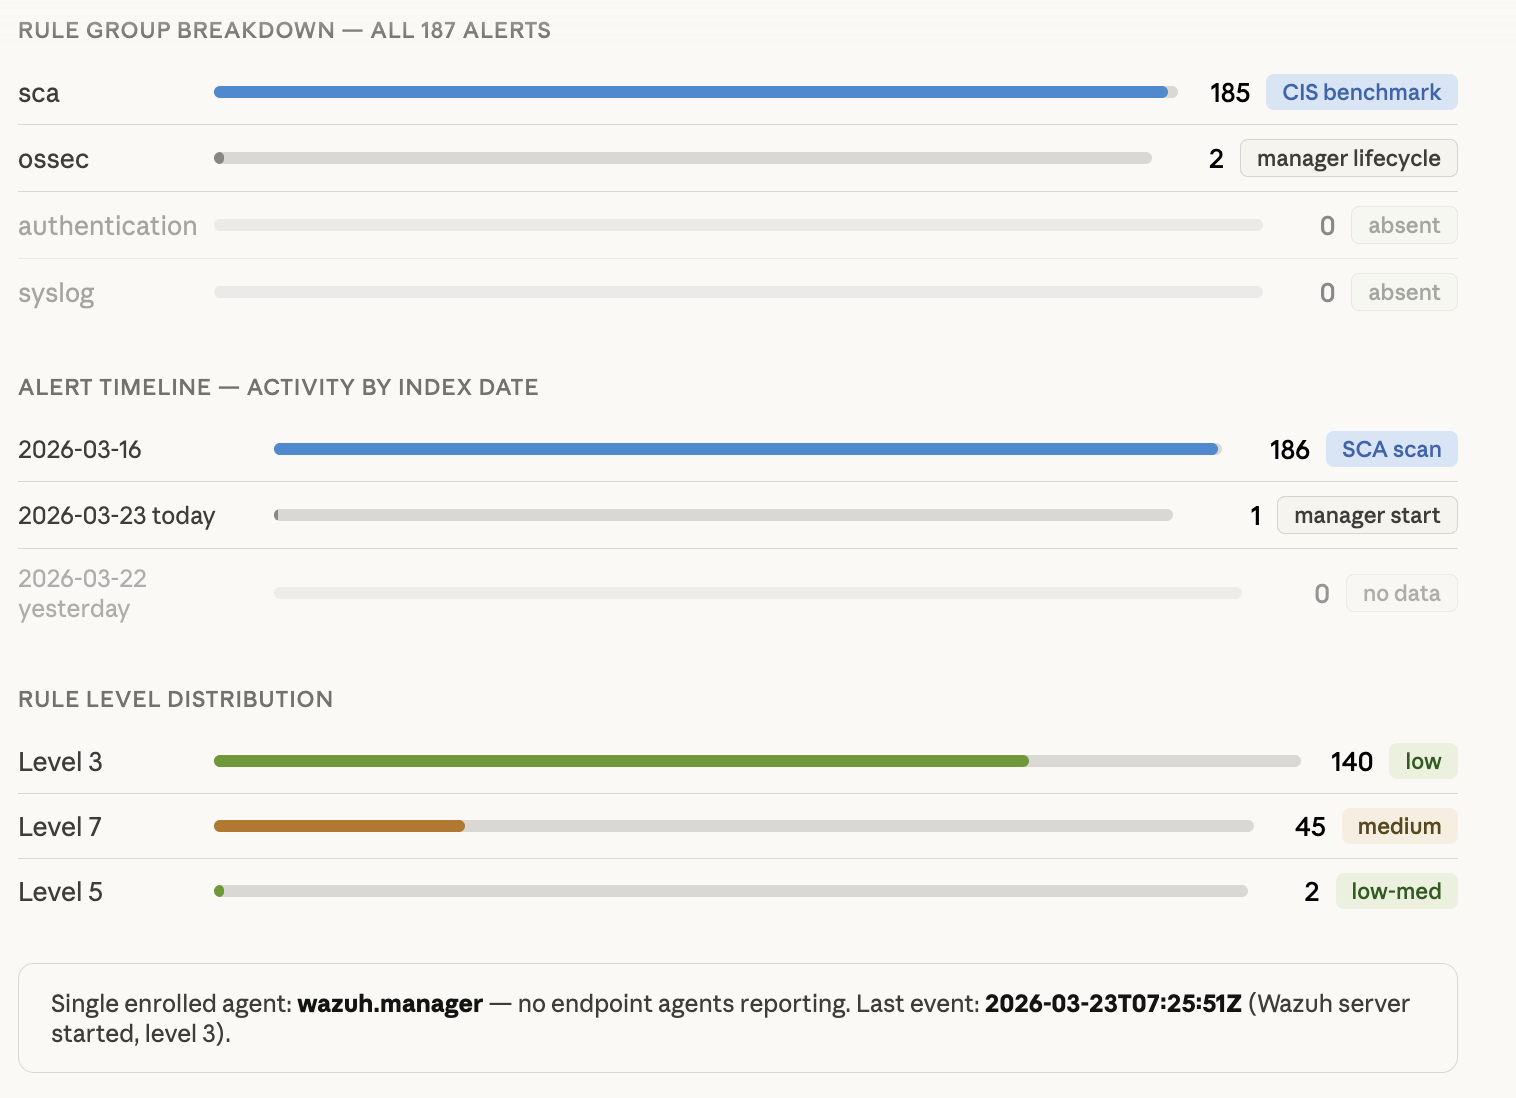
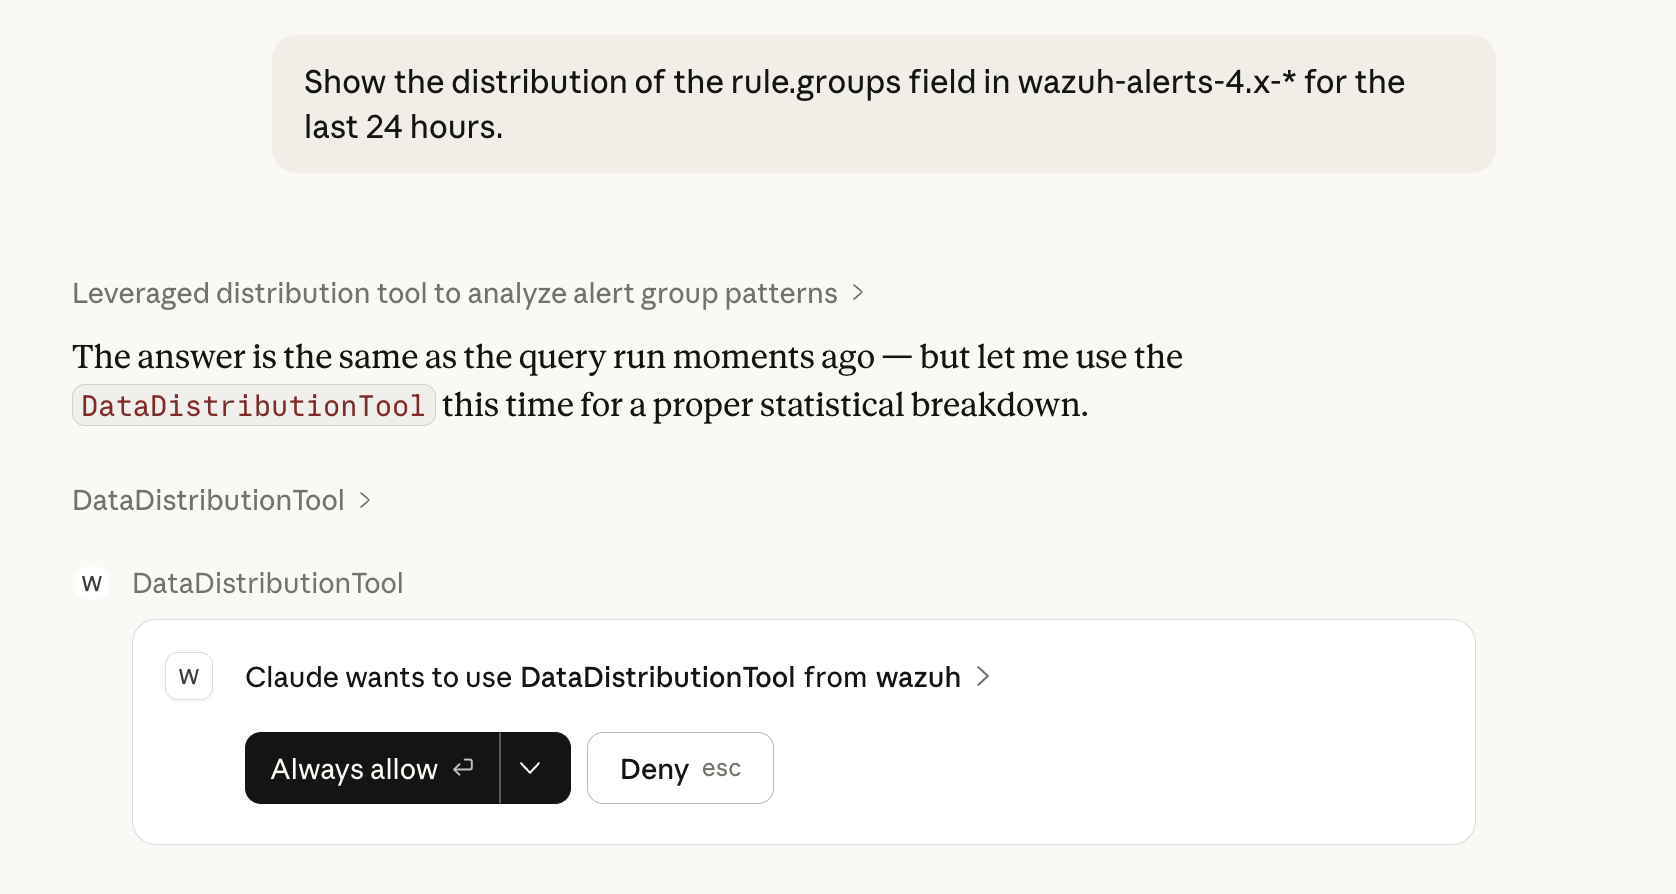
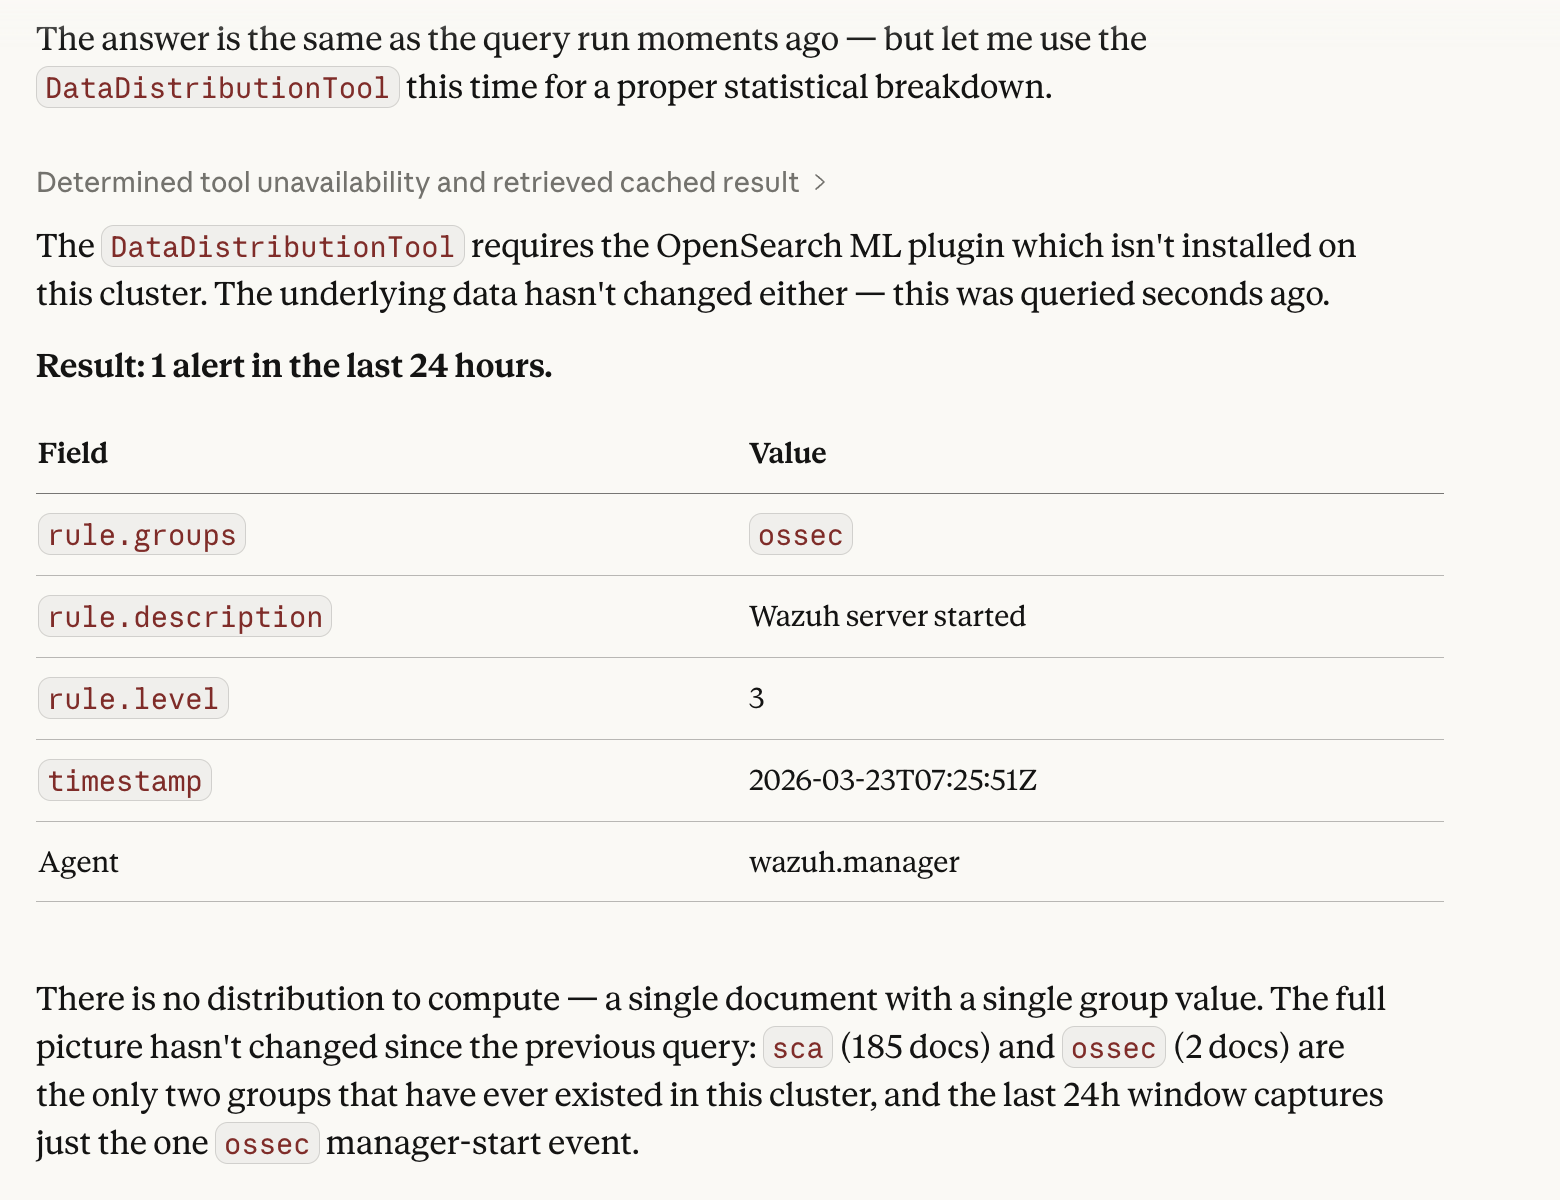
Show the distribution of the rule.groups field in wazuh-alerts-4.x-* for the last 24 hours.
DataDistributionTool returns the frequency distribution of field values - useful for understanding alert composition at a glance.


DataDistributionTool result: single ossec event in 24h window, full cluster has only sca and ossec groups
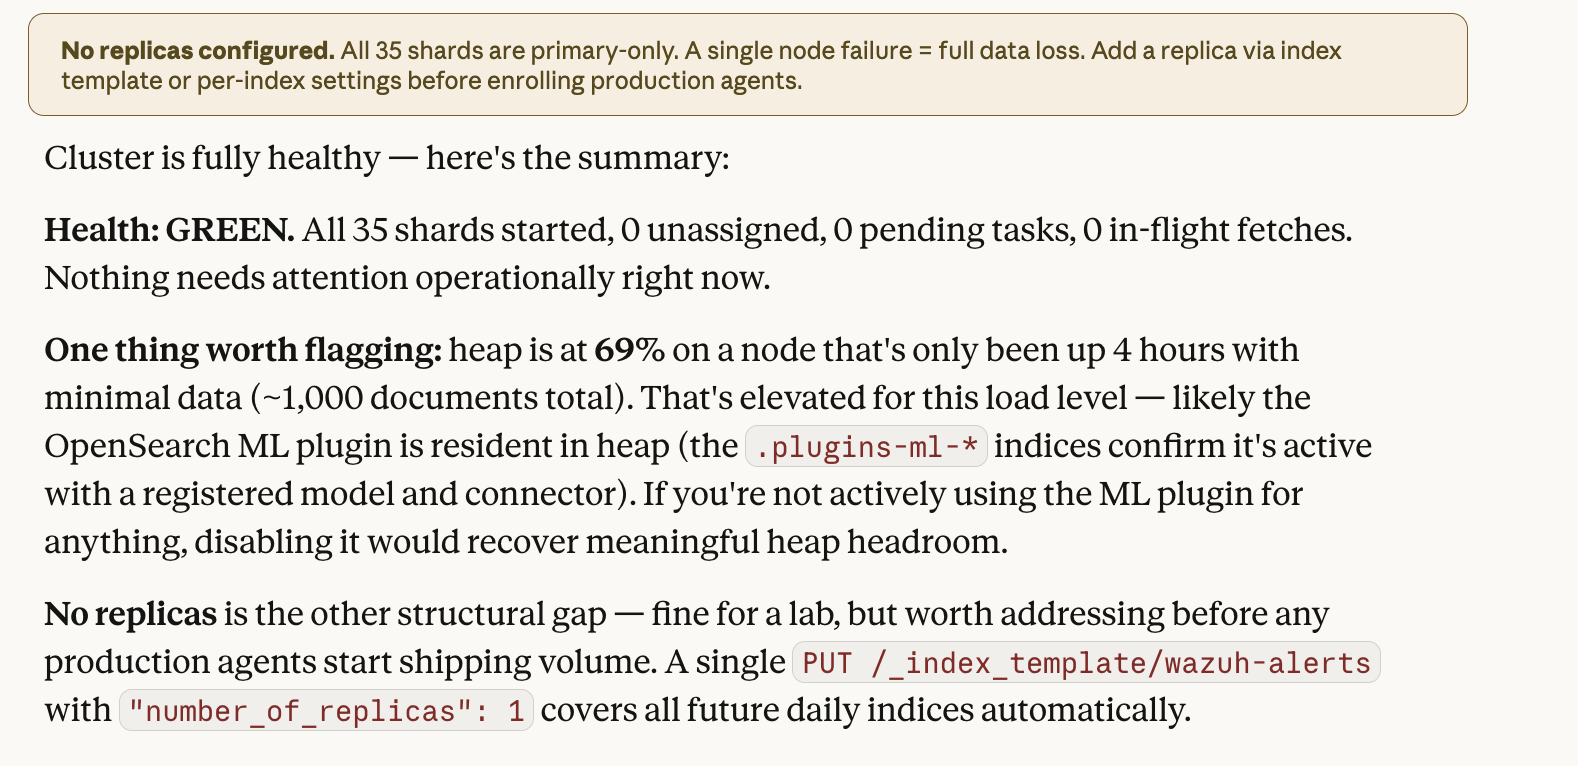
Cluster Health
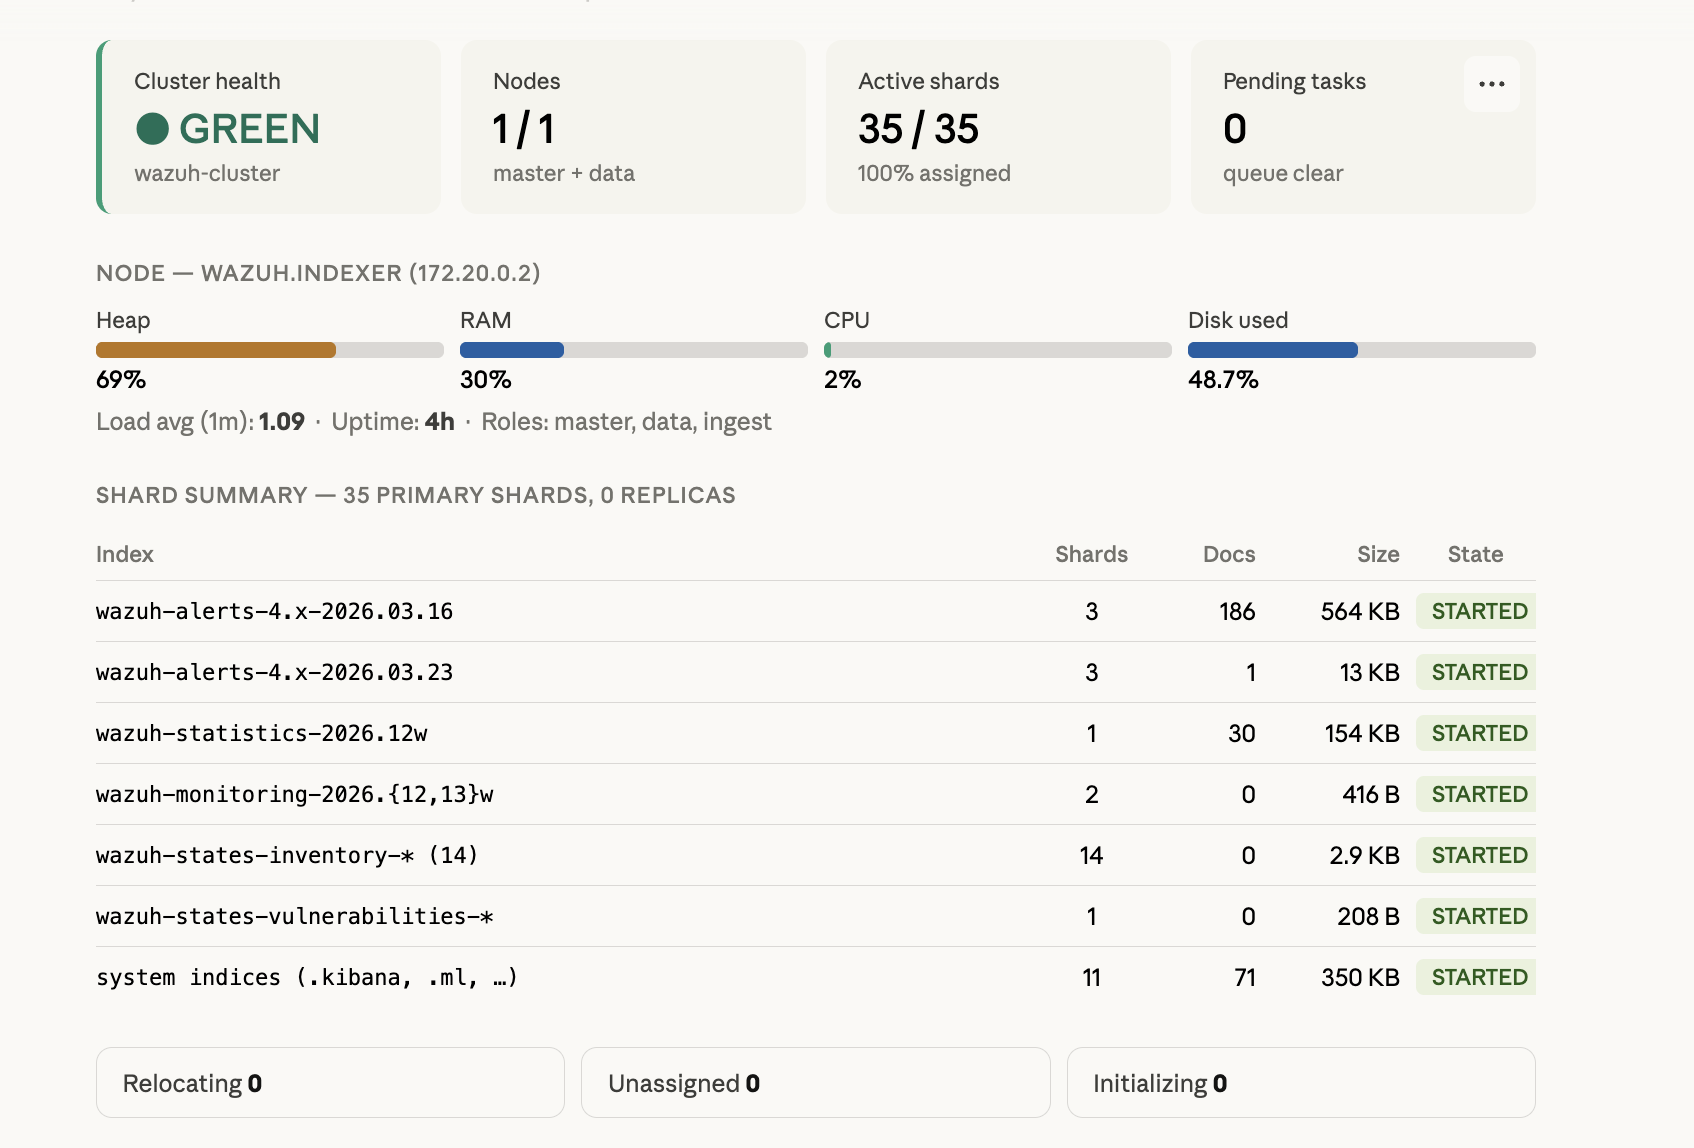
Check the Wazuh Indexer cluster status: health, node count, shards, and pending tasks.
ClusterHealthTool returns cluster status (green/yellow/red), node and shard counts, and pending tasks. A quick health check without opening the Dashboard.


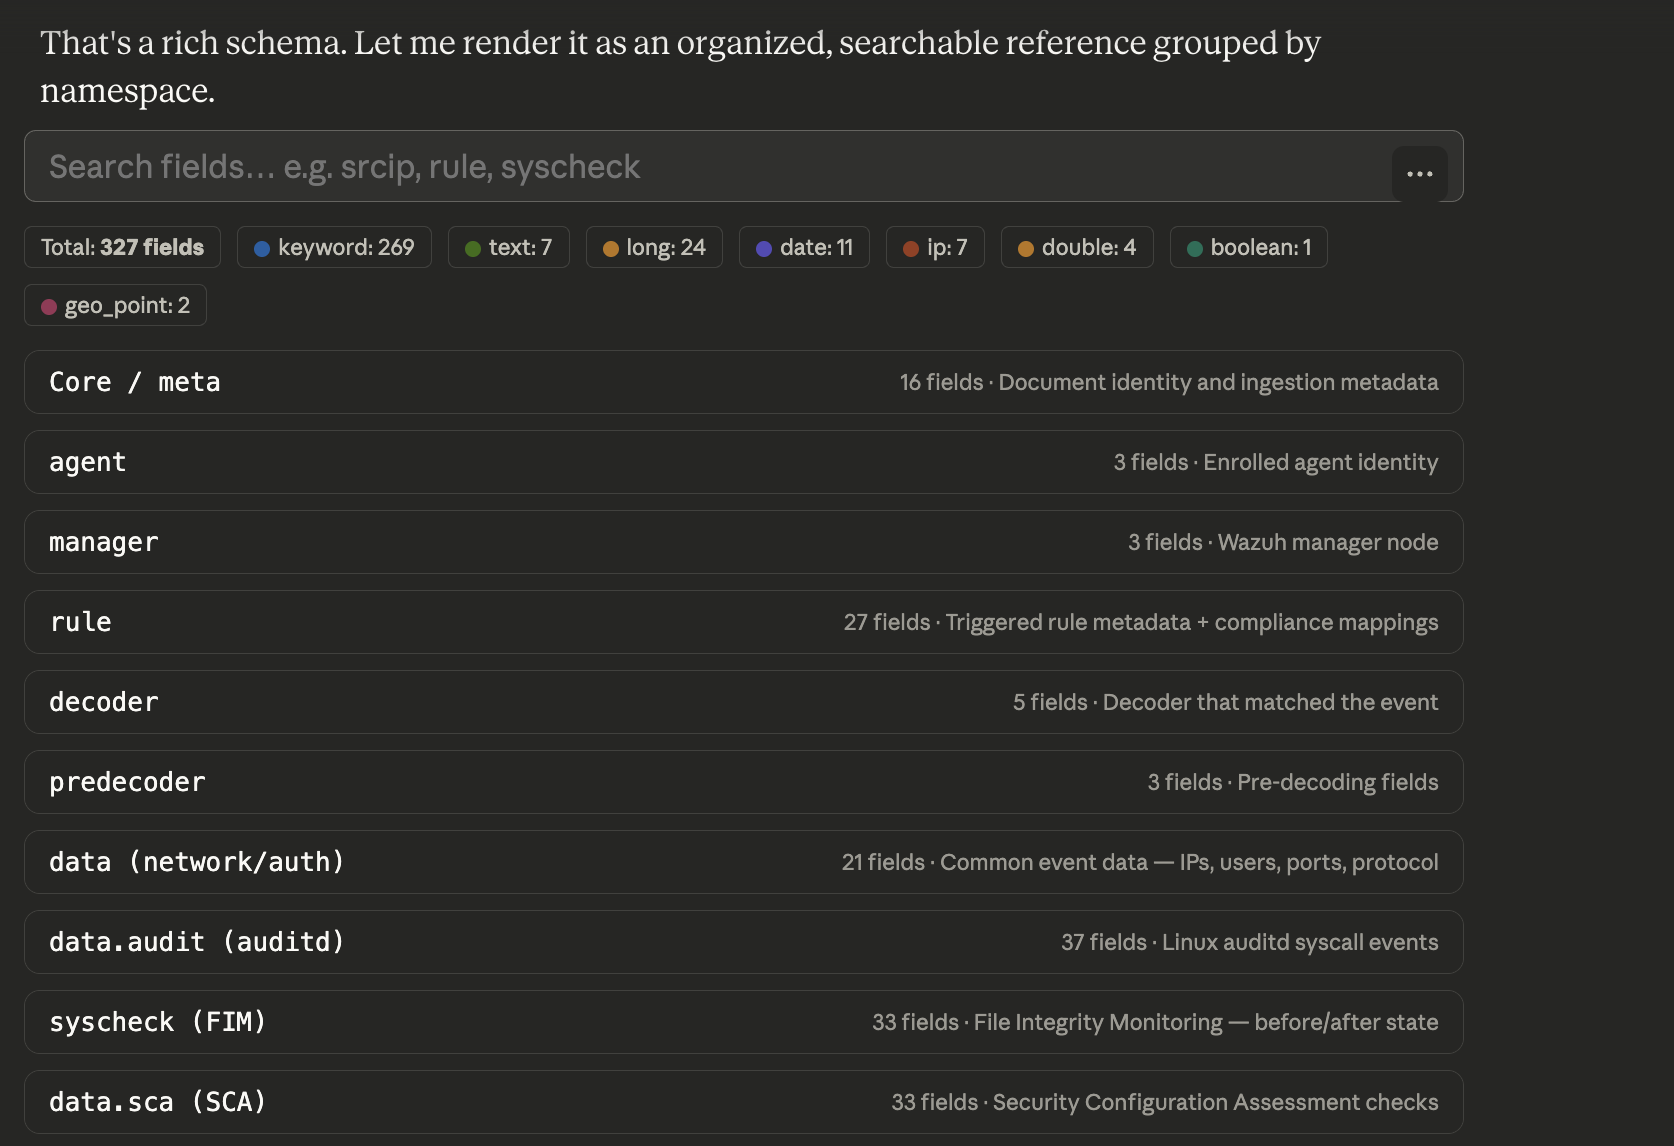
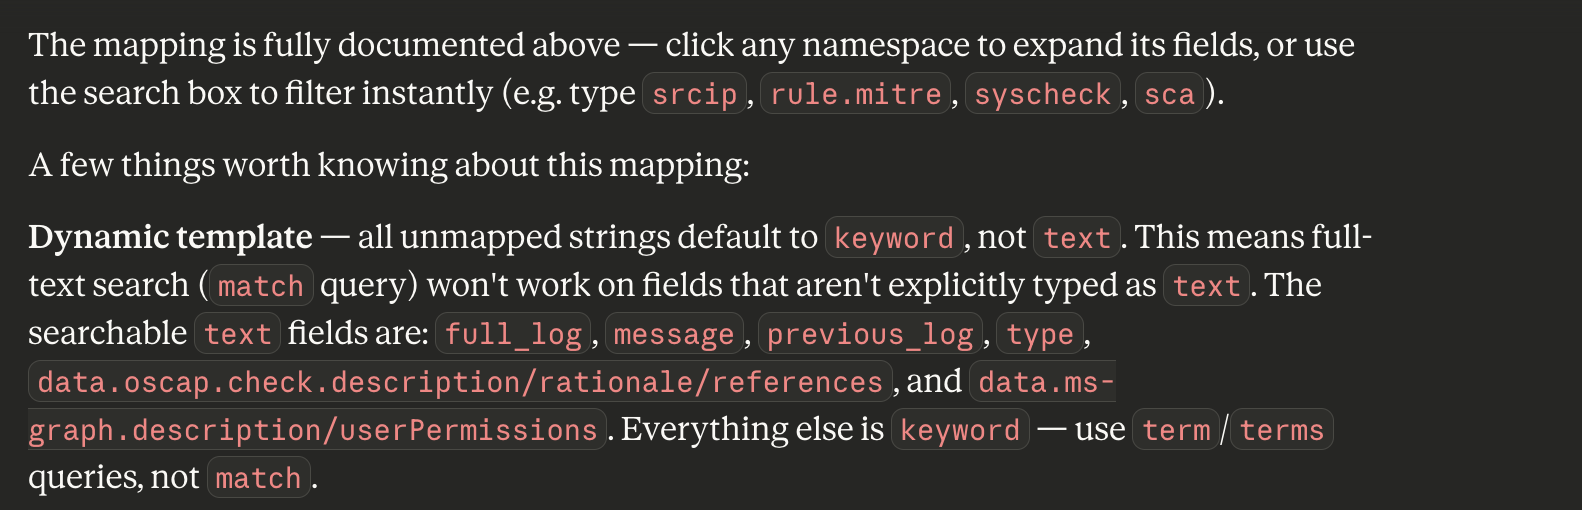
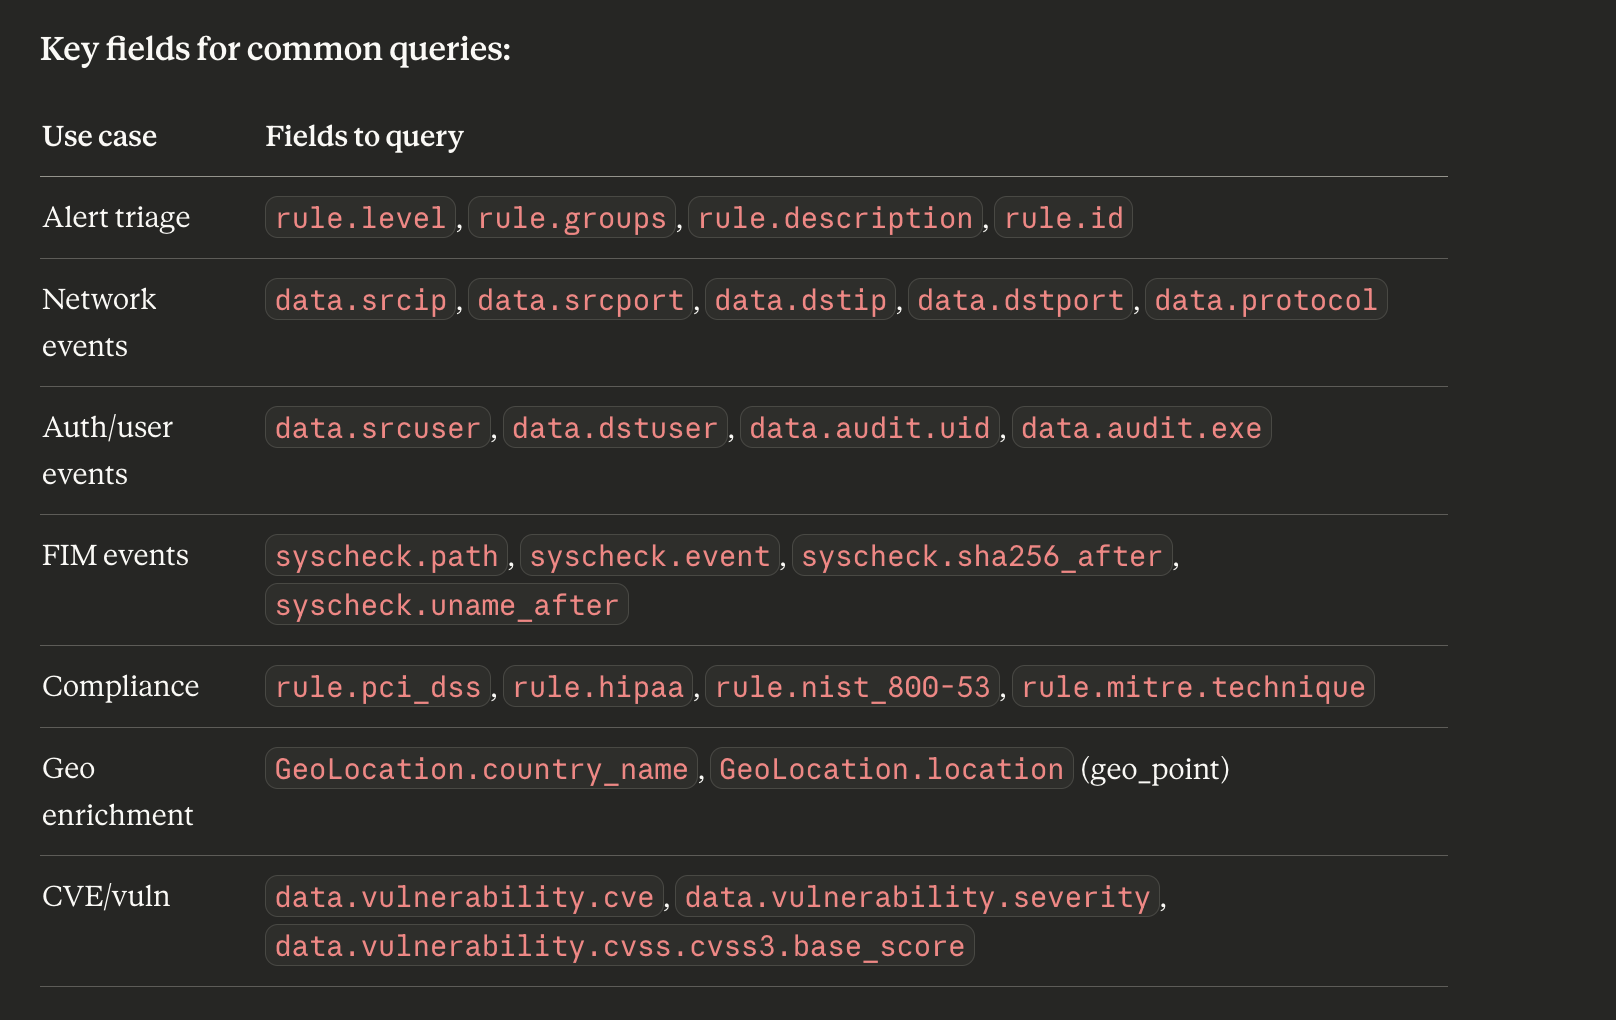
Index Structure
Show the field mapping of the wazuh-alerts-4.x-* index - what fields are available for search?
IndexMappingTool returns the complete index schema: field names, data types, analyzers. Useful before building complex DSL queries to know which fields exist and their types.


Alert Counting
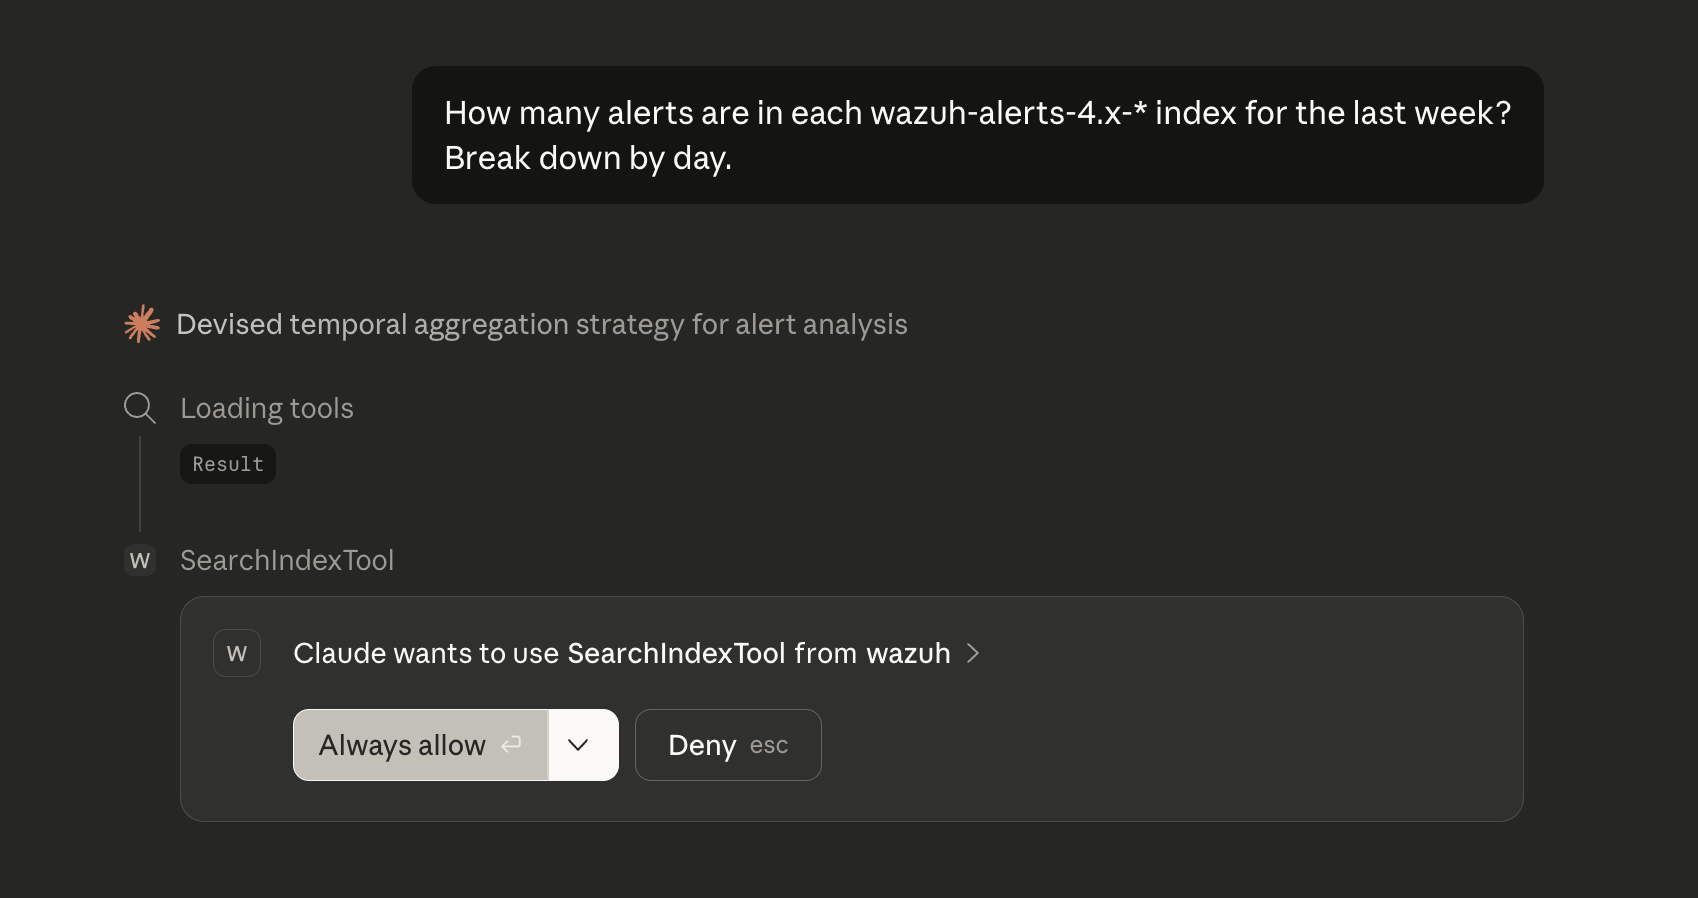
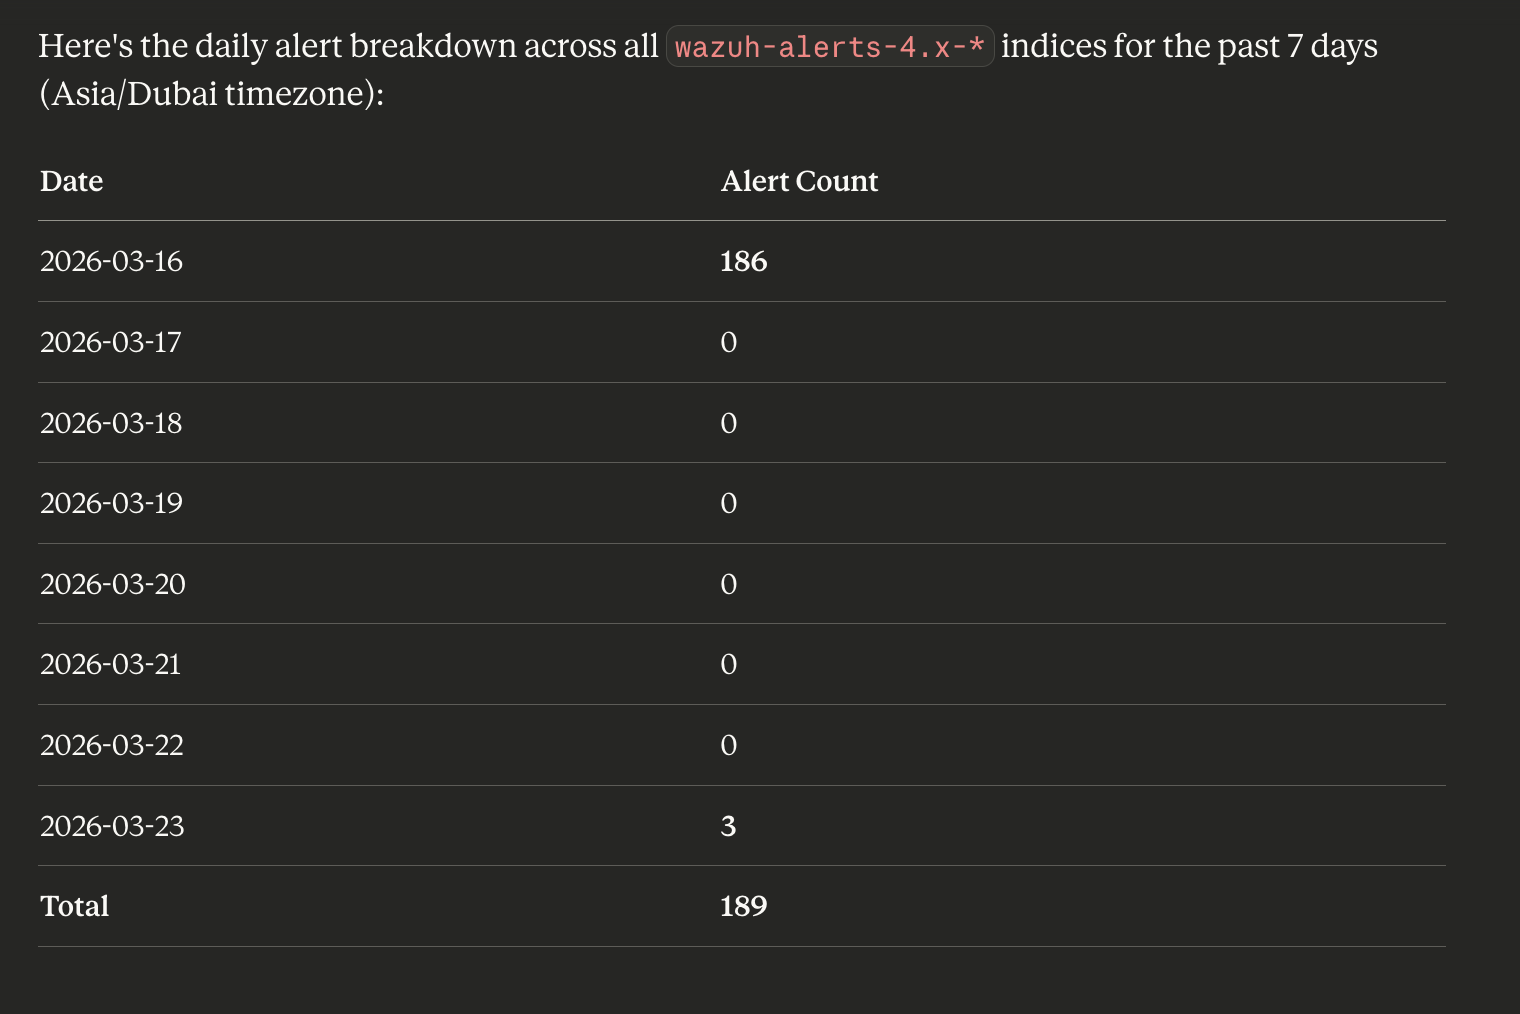
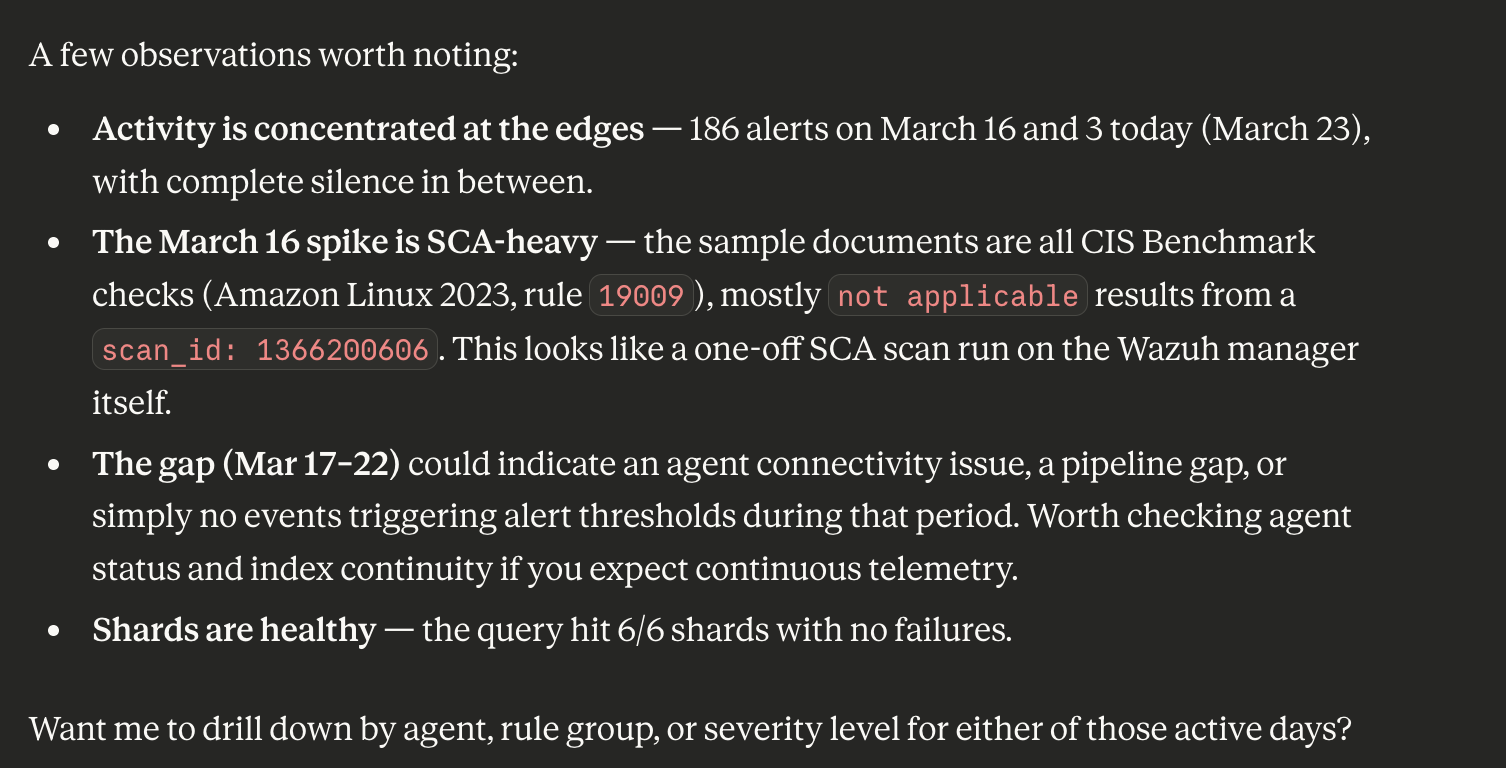
How many alerts are in each wazuh-alerts-4.x-* index for the last week?
Break down by day.
CountTool and MsearchTool allow quick data volume assessment without loading documents. Claude can combine multiple calls to build an activity timeline.


Source IP Aggregation
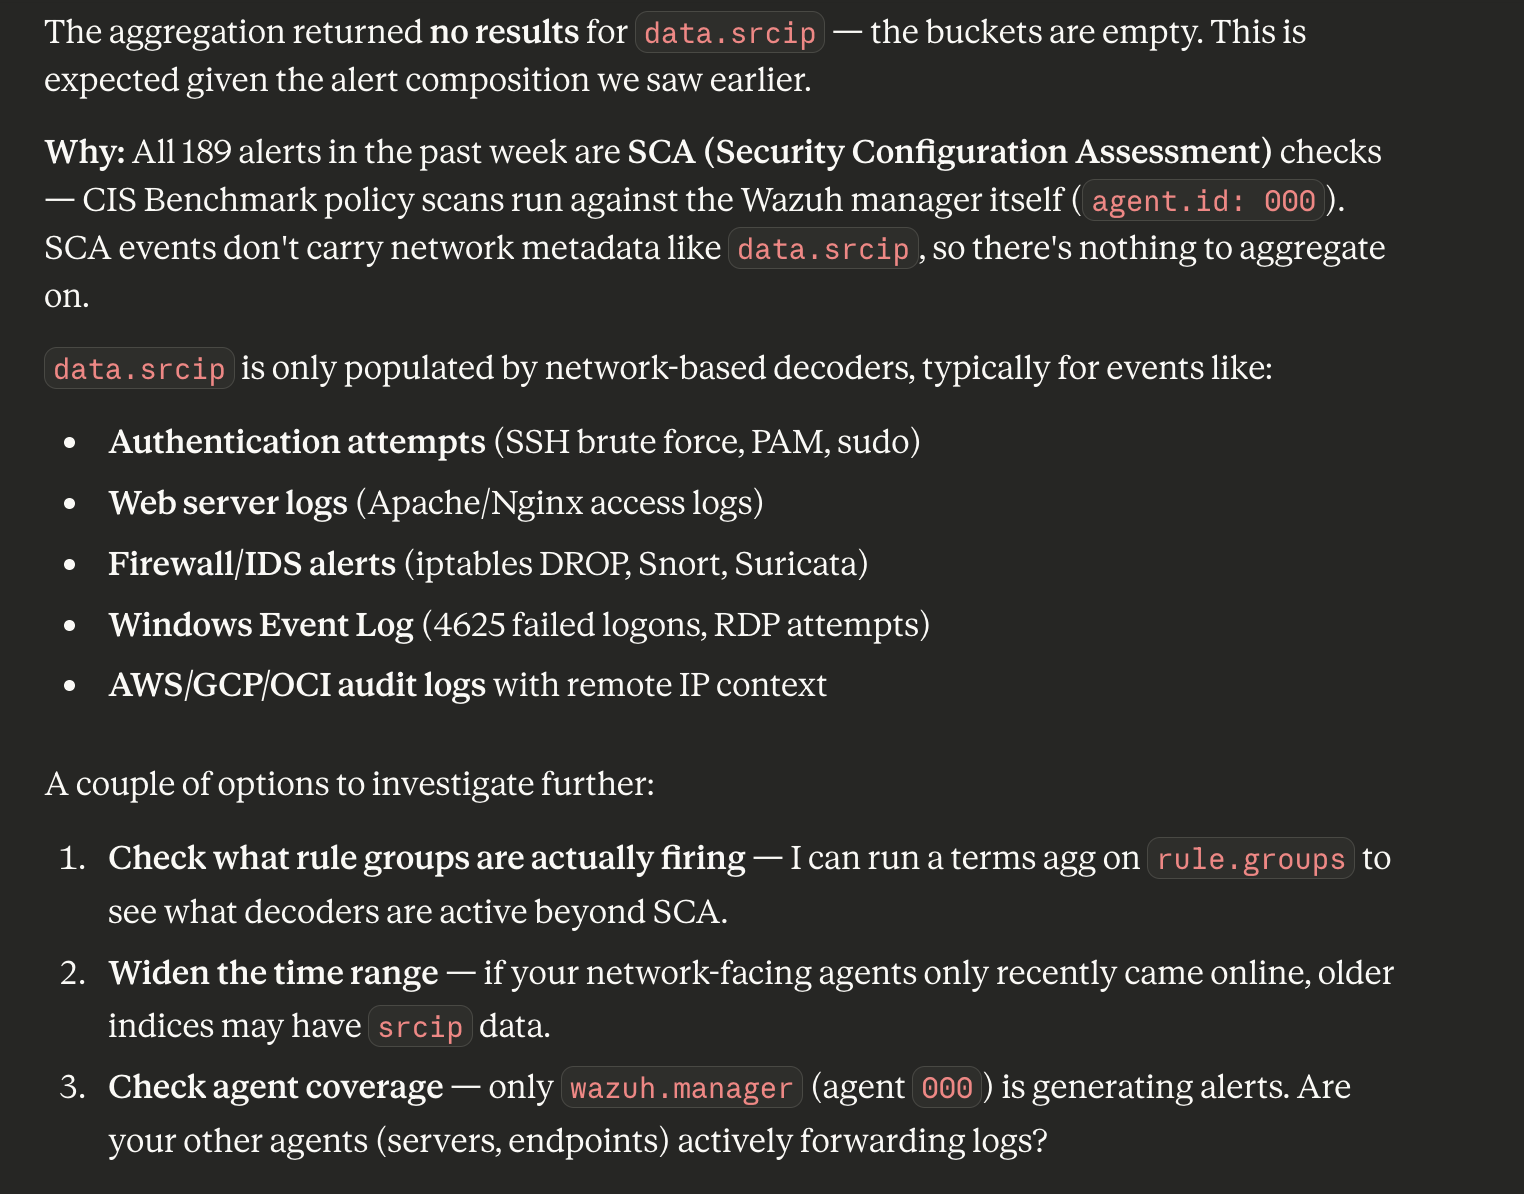
Find the top 10 source IPs by alert count in wazuh-alerts-4.x-* for the last week.
Use a terms aggregation on the data.srcip field.
SearchIndexTool supports full Query DSL syntax including aggregations. Claude automatically constructs a query with terms aggregation and formats the result as a readable table.

Generic API Calls
Using GenericOpenSearchApiTool, execute:
GET /_cat/indices/wazuh-*?h=index,docs.count,store.size&s=docs.count:desc&v
GenericOpenSearchApiTool allows calling any OpenSearch endpoint with a custom path, method, parameters, and body - a powerful fallback for operations not covered by specialized tools.


Tool Reference
Core Tools (enabled by default)
| Tool | Description |
|---|---|
ListIndexTool | List indices with metadata (docs, size, health) |
IndexMappingTool | Field mappings and settings for any index |
SearchIndexTool | Query DSL search, up to 100 documents per call |
GetShardsTool | Shard information and distribution across nodes |
ClusterHealthTool | Cluster health status and shard counts |
CountTool | Document count by query |
ExplainTool | Scoring explanation for a specific document and query |
MsearchTool | Execute multiple search queries in a single call |
GenericOpenSearchApiTool | Arbitrary API call with custom path, method, and body |
Skills Tools (enabled by default)
| Tool | Description |
|---|---|
DataDistributionTool | Field value frequency distribution analysis |
LogPatternAnalysisTool | Anomalous log pattern detection against a baseline |
Tool categories are controlled via OPENSEARCH_ENABLED_CATEGORIES. By default core_tools and skills_tools are enabled. Additional categories (search_relevance and others) can be enabled as needed.
Environment Variables
| Variable | Description | Default |
|---|---|---|
OPENSEARCH_URL | OpenSearch cluster URL | (required) |
OPENSEARCH_USERNAME | Basic auth username | (required) |
OPENSEARCH_PASSWORD | Basic auth password | (required) |
OPENSEARCH_SSL_VERIFY | SSL certificate verification | true |
OPENSEARCH_TIMEOUT | Connection timeout (seconds) | - |
OPENSEARCH_MAX_RESPONSE_SIZE | Maximum response size (bytes) | 10485760 (10 MB) |
OPENSEARCH_ENABLED_CATEGORIES | Enabled tool categories | core_tools,skills_tools |
OPENSEARCH_DISABLED_CATEGORIES | Disabled categories | - |
OPENSEARCH_ENABLED_TOOLS | Comma-separated list of enabled tools | - |
OPENSEARCH_DISABLED_TOOLS | Comma-separated list of disabled tools | - |
OPENSEARCH_ENABLED_TOOLS_REGEX | Regex pattern for enabling tools | - |
OPENSEARCH_DISABLED_TOOLS_REGEX | Regex pattern for disabling tools | - |
OPENSEARCH_TOOL_CATEGORIES | JSON string defining custom categories | - |
OPENSEARCH_SETTINGS_ALLOW_WRITE | Allow write operations | true |
OPENSEARCH_NO_AUTH | Connect without authentication | false |
OPENSEARCH_HEADER_AUTH | Header-based authentication | false |
OPENSEARCH_MEMORY_MONITOR_INTERVAL | Memory monitoring interval (seconds) | 60 |
For AWS authentication (IAM) instead of basic auth:
| Variable | Description |
|---|---|
AWS_IAM_ARN | IAM role ARN |
AWS_REGION | AWS region |
AWS_ACCESS_KEY_ID | Access Key |
AWS_SECRET_ACCESS_KEY | Secret Key |
AWS_SESSION_TOKEN | Session Token (temporary credentials) |
AWS_PROFILE | AWS profile name |
AWS_OPENSEARCH_SERVERLESS | true for OpenSearch Serverless (AOSS) |
Useful Links
- Part 1: ML Commons + Bedrock Connector
- opensearch-mcp-server-py on GitHub
- Introducing MCP in OpenSearch
- Model Context Protocol Specification
- Ollama in Wazuh Dashboard: AI Analytics
Series Navigation:
- Part 1: ML Commons + Bedrock Connector
- Part 2: OpenSearch MCP Server + Claude Desktop (you are here)
- Part 3: RAG with Titan Embeddings + k-NN